
A short squeeze is one of those market terms that gets thrown around by traders, journalists, and commentators, but does the audience always know what they are talking about?
The ability to sell short is one of the benefits of margin trading, but also probably one of the most underused and misunderstood areas of the business, particularly in equities.
Not least because the idea of selling something you don't actually own is an alien concept outside of trading.
But being able to sell short provides margin traders with a massive advantage over their stock trading peers, because the margin trader can potentially benefit from downside moves and trends in prices as well as the upside, and that's a big deal.
Short selling is both an art and a science, and it requires a high degree of trading discipline because when you are short of something, you have a theoretically open-ended loss profile. After all, there is no limit to how high a stock price can go.
That's probably another one of the reasons that most retail traders don't go short of the market.
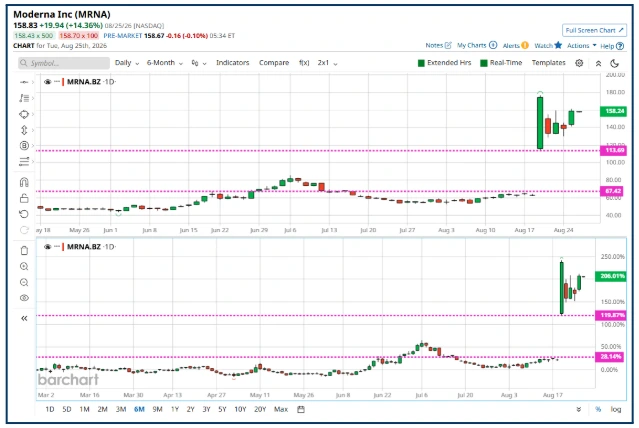
Shortsellers had their fingers burnt (perhaps even incinerated) recently when biotech firm Moderna MRNA US announced successful results from the trial of a new cancer treatment.
The stock jumped on that news, gapping up on the open by almost $70.00, and trading as much as another $60.00 higher intraday. This was the largest move in a single day ever in a large-cap US equity.
Source: Barchart.com
Food for thought
That move, and this table set me thinking.
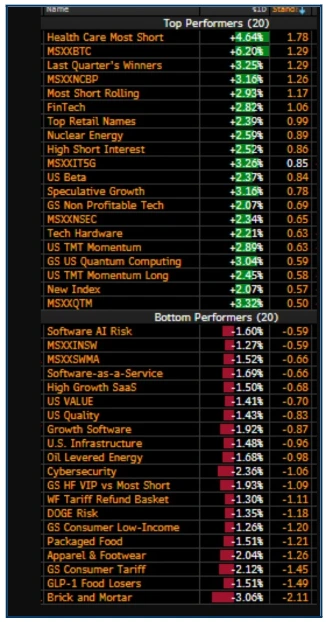
The table highlights the performance of stock baskets on 25/08/26.
It shows the top and bottom 20 performers on the day; Investment banks and others create these baskets (groups of stocks) to allow their clients to get rapid asset allocation to a theme or market-moving narrative.
These are very much aimed at institutional clients rather than retail traders, not least because the prices are only displayed on professional platforms such as the Bloomberg terminal.
A snapshot like this one can provide us with ideas and information; however, and as I say, it got me thinking. Because if we look at the top performers from 25/08, we can see that they are short baskets or, rather, they are baskets that track the performance of stocks that have been shorted by the market.
The question I asked myself was whether there was any way to look at short interest data and then use that data to highlight trading opportunities?
Source: Wells Fargo/Bloomberg
Of course, I don't expect to find the next Moderna, but perhaps we could find traits and setups that could offer high-probability trades. (As we will see, I came closer to that than I might have expected)
Looking for opportunities once more
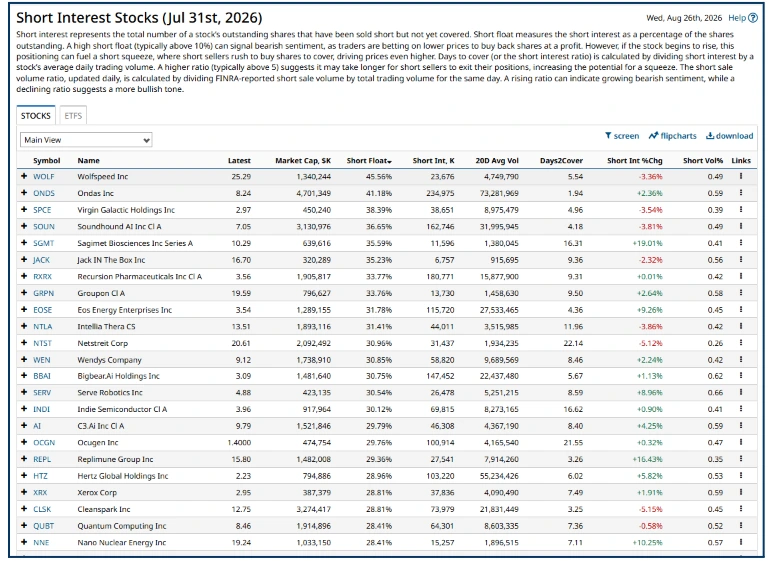
My first port of call, as ever, was Barchart.com, and it turned out they have a page dedicated to short sale data, a screenshot of which you can see below.
And this is certainly a very good starting point, albeit that some of the data is only updated monthly.
Source: Barchart.com
However, I wanted to be slightly more forensic and focus on stocks within the S&P 500, and so I created a screener to do just that.
The next step was to download the results from the screener into a spreadsheet and apply some additional filters, which I did. Looking for stocks which had high (ish) days to cover scores. That's the number of days (at current average volumes traded) it would take to buy back the total short position in the stock.
I also wanted stocks that had been positive over the last 5 days; I applied a filter at +5.0% or greater for this and +4.0 or greater for the days to cover - there was nothing significant about these numbers; they just looked /felt right to the wider data set.
Here is a snapshot of the table I was left with.

Source: Darren Sinden
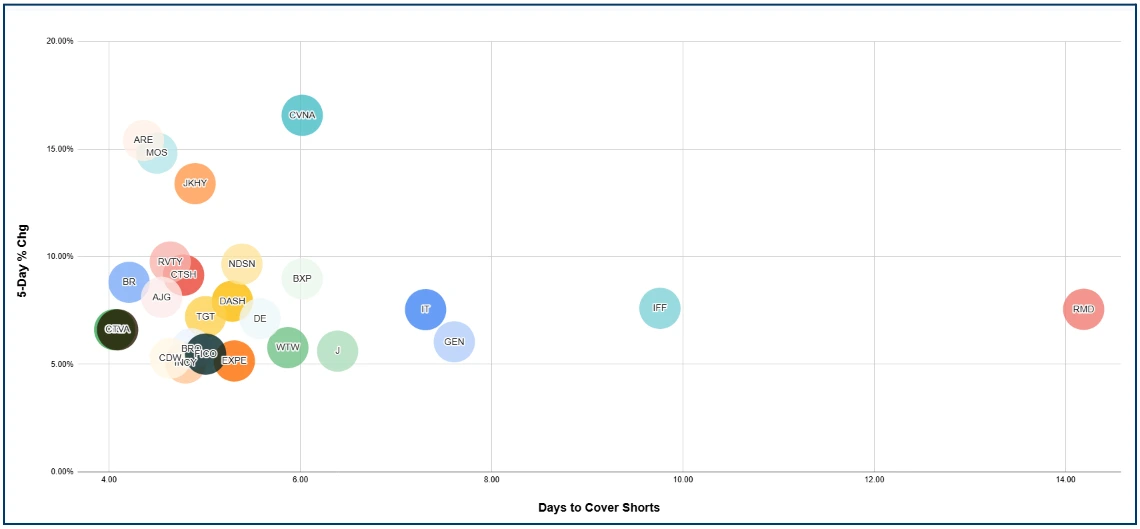
The next thing I did was to plot some of this data on a chart, as you are probably aware; I like bubble charts for this kind of thing as you get an immediate sense of how the land lies from the visualisation.
The chart shows Days to Cover Shorts vs 5-day % change.
Source: Darren Sinden
Among the stocks that met the criteria are a couple of names that I have been following for different reasons: Gartner, IT US and Nordson NDSN US.
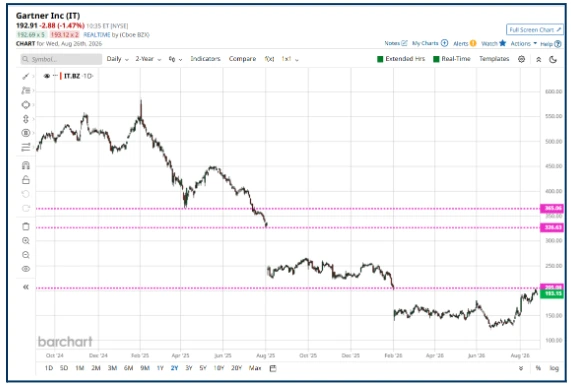
Here is a two-year chart of Gartner; it's one of those charts that needs a catalyst to get it moving.
Now as to the short position: Gartner has a short float of -15.28% and would need +7.30 days of trade to cover it. However, it has also seen a -16.02% drop in the size of the short position and the stock is up +7.54% in 5 days and by +39.35% over the last month.
Source: Barchart.com
As such, Gartner remains near the top of my watch list
Coincidence or making your own luck with local knowledge?
Coincidence is a funny thing because at 14.06 today (26-08-26), whilst I was in the middle of writing this article, I shared the following posts with the members of my Idea Factory chat group.
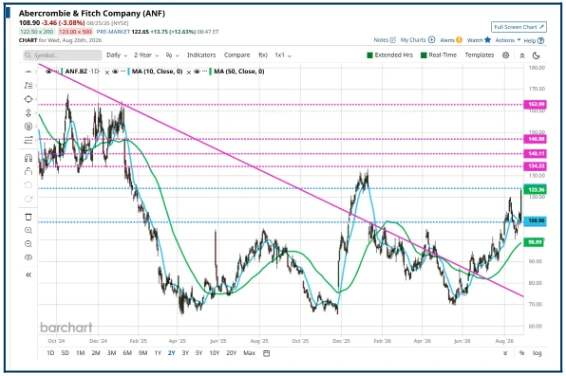
Firstly, the chart of clothing retailer Abercrombie and Fitch ANF US with the stock's pre-market move of +12.63 % (see below) and my comment:that:
“ANF US could run further today”
Darren Sinden 2.05 pm 26-08-26
Source: Barchart.com
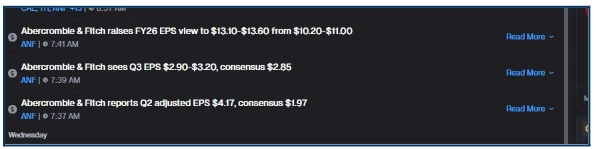
Secondly, the news headlines that were behind that pre-market move: a substantial earnings beat and higher guidance.
Source: The Fly
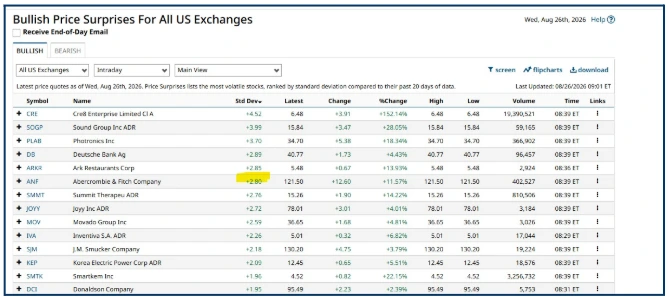
The third thing I shared, which confirmed to me that ANF could have a bigger run, was the level of standard deviation in the pre-market move, measured against the prior 20 days of trading.
Which, at +2.80, should occur approximately once in every 200 trading days. So it's pretty rare.
Source: Barchart.com
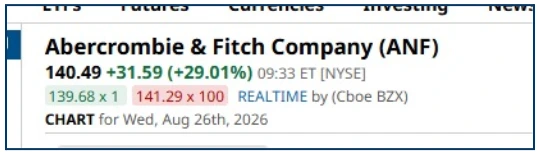
My thoughts turned out to be correct, because 31 minutes later I was able to share this image to the chat showing the stock up +29.01% in the main session. It would trade even higher than that later in the day.
Source: Barchart.com
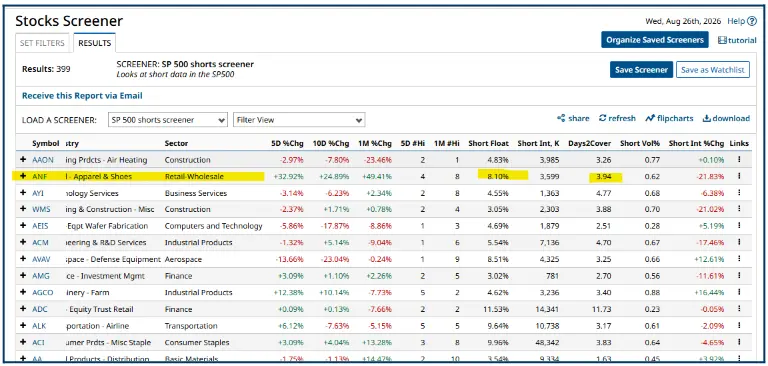
Now here is the coincidence: ANF US were among S&P 400 names that had a meaningful short position: -8.10% of the float was short, and almost +4 days of trade were needed to cover it.
When you combine that with an earnings beat and a sharp move higher pre-market, you have the catalysts for a significant move /re-rating.
The thing is, I hadn't run my new short screen on the S&P 400 before the event.
Source: Barchart.com
Abercrombie and Fitch traded as much as +36.0% higher on the day, and to my mind much of that was driven by the short position in the stock, and the bears being forced to back or cover those shorts and being squeezed hard as they did so.
Yes, of course, there was a confluence of factors at work here, but I believe my job is to find the setups and opportunities that are full of potential and then wait for the catalysts for price change to appear, which they often do.
How many more opportunities like this are there out there? And can we identify them?
I think the answer is yes, we can, using the methodology above or something similar to it.
The information provided does not constitute investment research. The material has not been prepared in accordance with the legal requirements designed to promote the independence of investment research and as such is to be considered to be a marketing communication.
All information has been prepared by ActivTrades (“AT”). The information does not contain a record of AT’s prices, or an offer of or solicitation for a transaction in any financial instrument. No representation or warranty is given as to the accuracy or completeness of this information.
Any material provided does not have regard to the specific investment objective and financial situation of any person who may receive it. Past performance is not a reliable indicator of future performance. AT provides an execution-only service. Consequently, any person acting on the information provided does so at their own risk. Forecasts are not guarantees. Rates may change. Political risk is unpredictable. Central bank actions may vary. Platforms’ tools do not guarantee success.