
Month-end is always a good time to look back and take stock of what’s happened in the market.
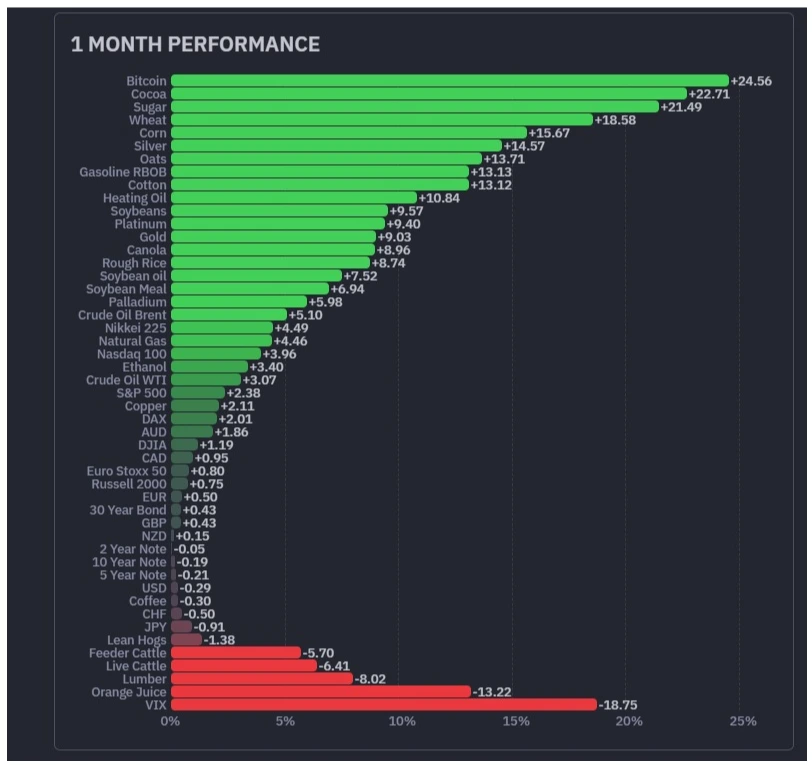
The larger of the two tables below shows the percentage change during August in various asset classes as measured by US futures.
What stands out straightaway is the resurgence in Bitcoin, which rallied by +24.56% over the 8th month of the year.

Source: Barchart.com
That is a significant improvement on the average performance for the cryptocurrency, compared to the mean figure for August dating back to 2010, which is a gain of just +0.73%.
In contrast, the average performance in September is negative with a near -4.00% loss. If BTC can post a positive return in a historically negative month, that would say a lot to me about price action strength in the coin.
Source: Finviz.com
At the bottom of the performance table is the VIX index, a measure of the volatility of the S&P 500 constituents. Sometimes called the greed and fear index, it’s really a measure of the probability of stocks making large unexpected price moves. The lower the VIX is, the less likelihood of sharp price moves, particularly on the downside. And by extension, a higher probability of a trending market and stock prices
Once again, the move seen in August is at odds with the average move back to 2010.
The VIX lost -18.75% vs an August average gain of +11.20%.
As for September, the average move in the VIX is a gain of +7.12%, but given the sharp move lower last month, that doesn't feel too likely to me.

Source: Barchart.com
Looking elsewhere in the performance table, foodstuffs and ingredients are well represented at the top end. Could that be a result of higher energy (fertilisers and feed) prices, which can be a driver of food inflation?
Higher inflation might well influence the Federal Reserve's thinking on interest rates as we head towards year-end.
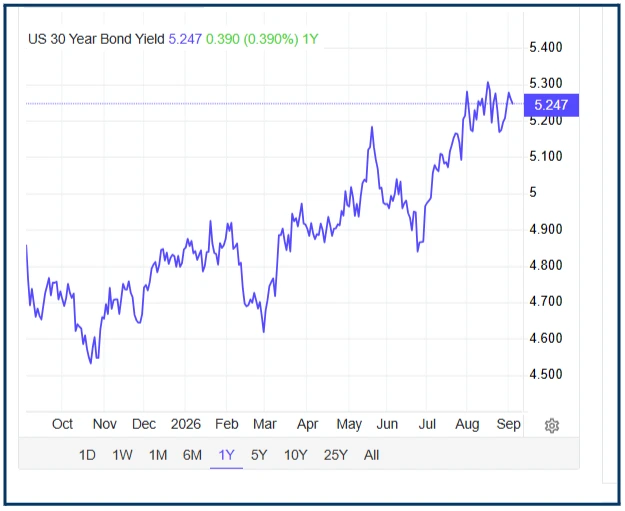
US 30-year bond yields, a benchmark for US Govt borrowing costs, have been rising once more, anticipating a Fed rate rise perhaps? None of which is a good look for the Trump administration heading into mid-term elections in November.
Source: Trading Economics
Earnings
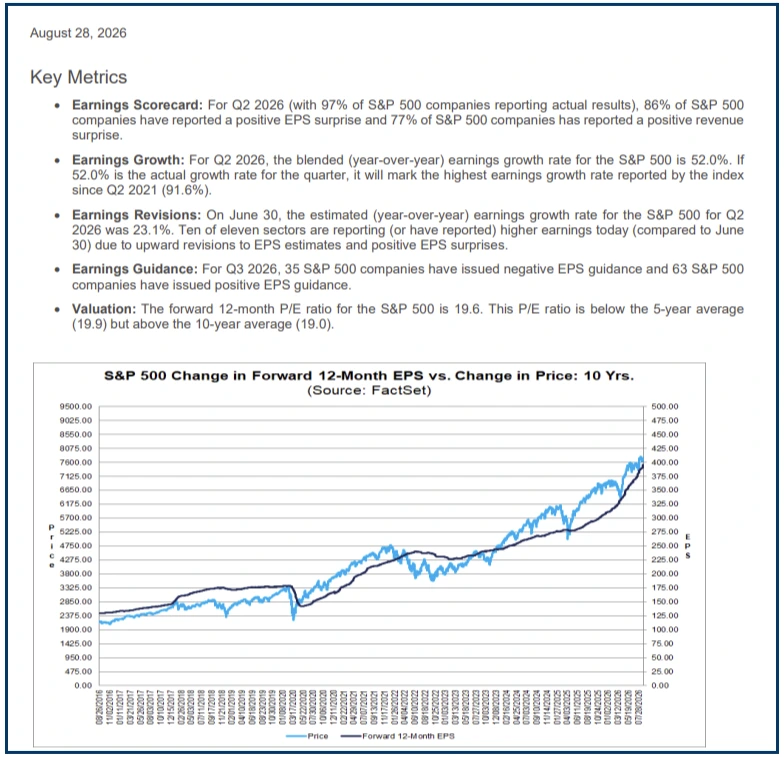
August also contained a big chink of earnings season, and US equities didnt disappoint, at least as far as earnings and revenue beats were concerned. A Blended earnings growth rate of 52.0% per annum for the S&P 500 is nothing short of spectacular, with 10 out of 11 S&P sectors reporting higher earnings when compared to estimates as of the end of June 2026. There is much to be positive about in equity markets.
Not least because US stocks don't appear to be overvalued, judging by their PE ratio, with the S&P sitting on a multiple of 19.60 times and therefore below the 5-year average PE for the index
Source: Factset
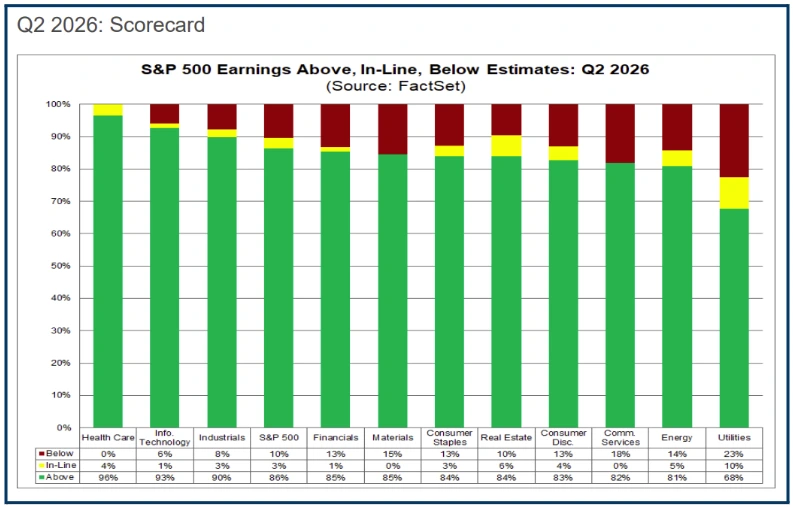
This chart captures the breadth of the earnings beat by sector: The green portion of each column is the % of stocks in a sector that beat expectations; yellow denotes an in-line report; red signifies a miss.
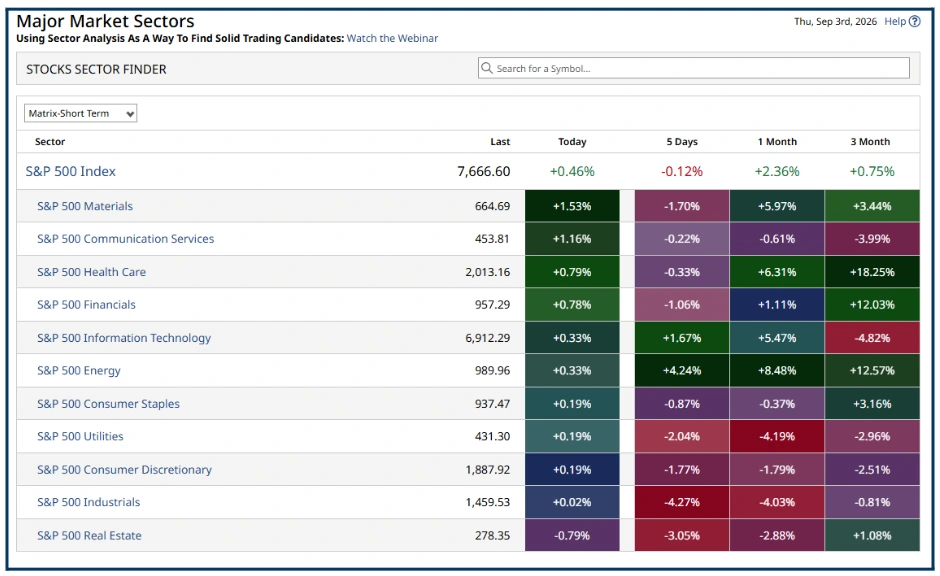
No surprise that Healthcare should be one of the best-performing S&P 500 sectors over the last month, up by +6.31%; however, it was energy that saw the biggest gains, with the sector index up by almost +8.50% over the last month.
Source: Barchart.com
By contrast, Industrials, which had the 3rd highest percentage of earnings beats, was the worst-performing sector, losing just over -4.0%.
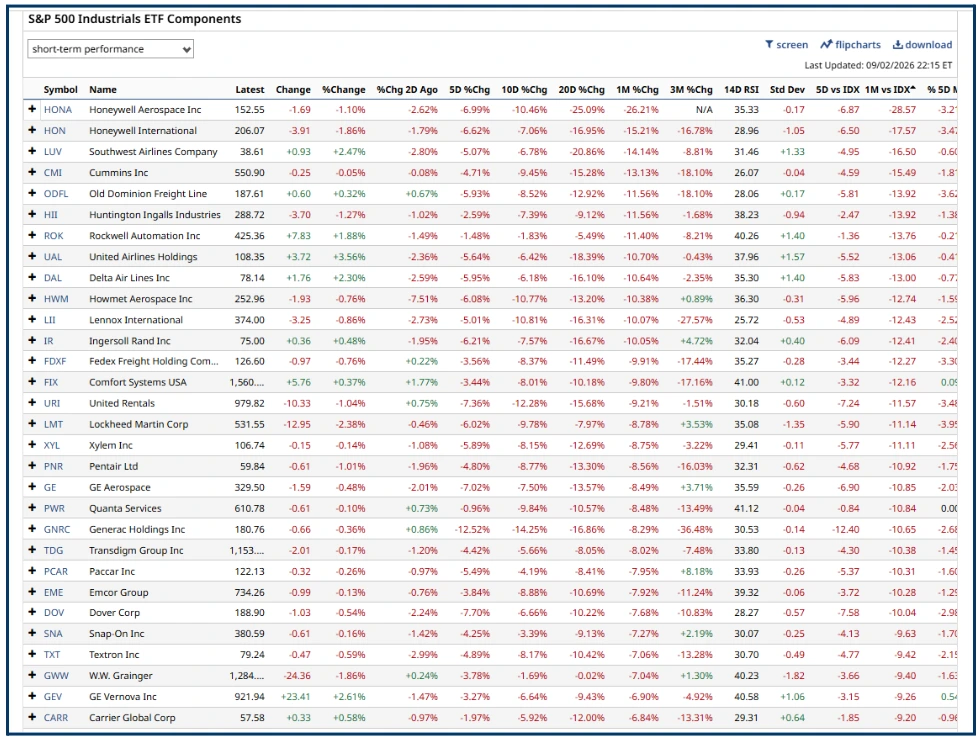
Here is a snapshot of some of the stocks within the sector ranked by their performance against the S&P 500 index (1M vs IDX), in ascending order; for example, Honeywell Aerospace underperformed the S&P by -28.57%.
Source: Barchart.com
Might there be some opportunities for a price rebound within this list? A long list like this is a starting point for some deeper research.
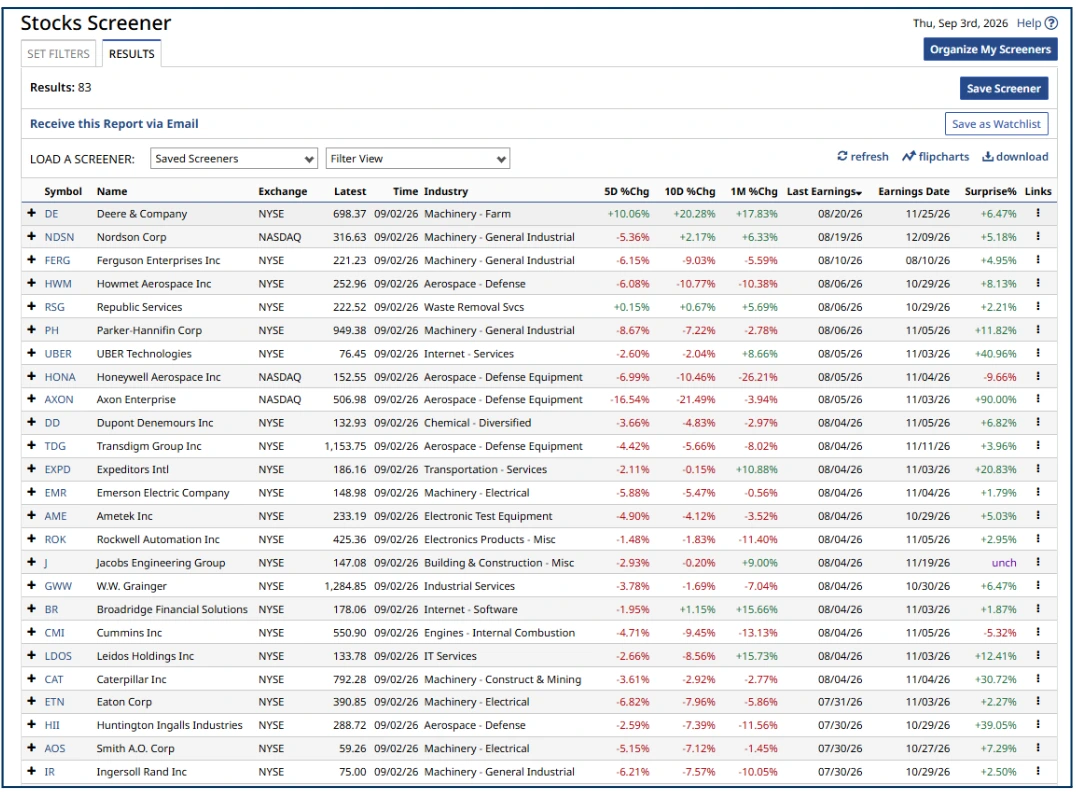
For example, here I have created a view/ screener that shows 5d,10d, and 1-month % changes in the last and future earnings data and the earnings surprise from the most recent earnings among S&P 500 Industrial stocks. Stocks which posted an earnings beat but which are down in the short term, like Parker Hannifin PH US and Uber UBER US, are of interest.
Source: Barchart.com
The next step might be to look at a few charts and see if anything stands out. A Дcurious mind is not a bad trait in a trader.
Just a reminder that all the resources that I have used for the data and charts in this article are either free or available for a minimal cost.
The information provided does not constitute investment research. The material has not been prepared in accordance with the legal requirements designed to promote the independence of investment research and as such is to be considered to be a marketing communication.
All information has been prepared by ActivTrades (“AT”). The information does not contain a record of AT’s prices, or an offer of or solicitation for a transaction in any financial instrument. No representation or warranty is given as to the accuracy or completeness of this information.
Any material provided does not have regard to the specific investment objective and financial situation of any person who may receive it. Past performance is not a reliable indicator of future performance. AT provides an execution-only service. Consequently, any person acting on the information provided does so at their own risk. Forecasts are not guarantees. Rates may change. Political risk is unpredictable. Central bank actions may vary. Platforms’ tools do not guarantee success.