
July was an extraordinary month in equity markets for all sorts of reasons, but it was also one that was particularly difficult to trade unless you were prepared to play the swings in sentiment towards software, chips, and AI, which seemed to turn on a whim without any obvious catalyst.
Except perhaps Korea’s Kospi index, which did act as an indicator for sentiment towards the memory and wider chip sector
Although the moves in the index, and the effect on sentiment were magnified, because of the level of gearing in the Korean market. Where hundreds of thousands of Korean retail traders were (over?) exposed to leveraged ETFs and other products that track the Kospi index.
That is effectively a two-horse race between Samsung and SK Hynix.
It ended badly, as overleveraging always does, a lesson that was reinforced by the liquidation of hedge fund Situational Awareness's listed equity portfolio.
Taking stock
The end of one month and the start of another provide us with an opportunity to look under the hood of the market, and to do so away from the headline noise.
There are some great tools out there that provide summaries, and the Factor Dashboards from S&P Dow Jones are a great example.
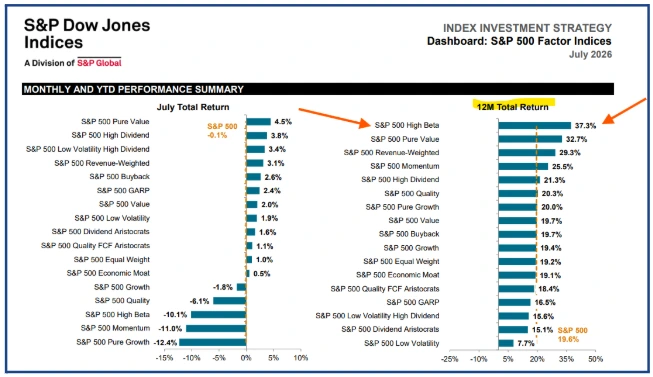
The image below is a snapshot of the report for US markets in July 2026.
One thing that stood out to me was the impressive performance of high beta stocks over the last 12 months, which are up by +37.30%; however, as we will see later in the article, beta has become something of a moveable feast.
And indeed, if we look to the bottom left-hand side of the table, we find that high beta stocks performed poorly in July, down by -10.10%.
Investment styles that performed well during July, and over the prior 12 months, include Pure Value and High Dividend, styles that might be considered old-fashioned in the modern market.
But as I highlighted recently in the article, Enterprising Ideas, well-thought-out strategies should never go out of fashion.
“To be clear, a value stock is one whose share price does not reflect its fundamentals. The implication here is that the market has mispriced or undervalued that security. The value investor takes positions in these types of stocks in the belief that the market will realise its mistake and reevaluate the stock and its pricing”
Darren Sinden
Source: S&P Dow Jones
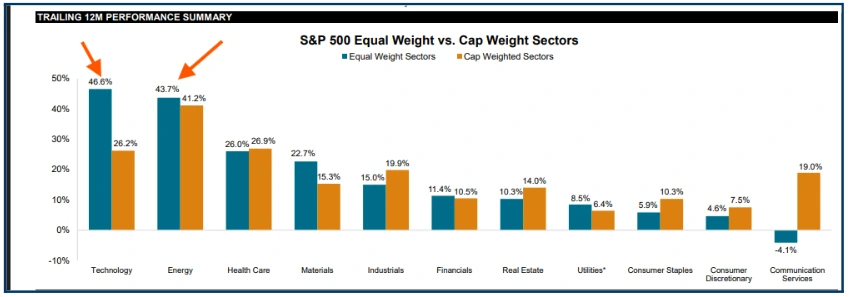
There was also further evidence that it remains a stock picker's market, as highlighted by the fact that in the Technology, Energy and Materials sectors, the equal-weight sector indices continue to outperform their cap-weighted peers.
Source: S&P Dow Jones
In the case of Technology, equal weight is outperforming by a considerable margin.
This tells us that the Magnificent 7 haven't been the sure thing that they once were.
Active traders and funds with the right stock selection should be capitalising on this.
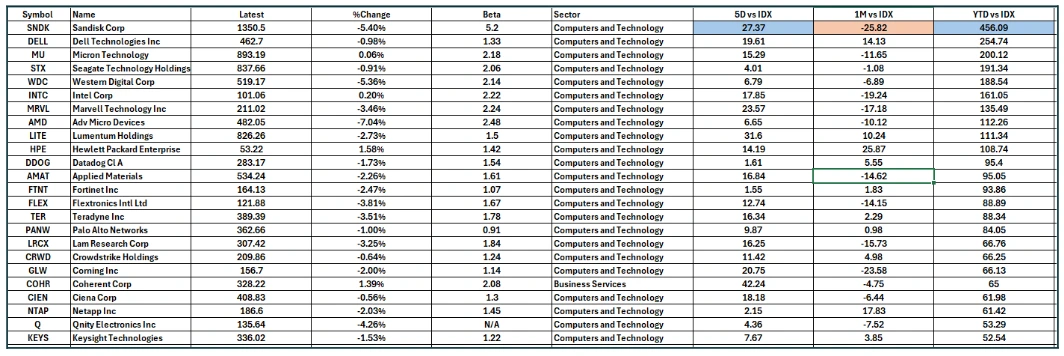
Here is a sample of the S&P 500 Technology stocks ranked by year to date performance vs the index (YTD vs IDX). Sandisk topped the table, but look at their performance during the last month (1M vs IDX) and then contrast that with their 5-day performance (5D vs IDX)and then note how high Sandisk Beta is.
Source: Darren Sinden
Experiments in Beta
Back in October 2025, I wrote a couple of articles about getting the “biggest bang for your buck”, and in the second article, the link to which is shown here.
https://www.activtrades.co.uk/en/news/the-biggest-bang-for-your-buck-part-ii
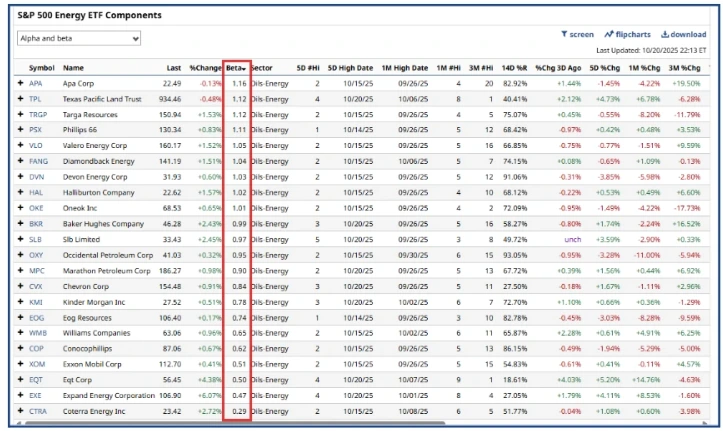
I started an experiment using the S&P 500 Energy sector as my lab rats. I ranked the stocks in the sector by their Beta, or sensitivity to a change in the S&P 500
Saying:
“ Simply put, the prices of stocks with higher Betas should move more than those with a lower Beta.”
Notwithstanding the data and comments above, let’s see if that assertion held over the last 10-months
Here is the table from October's article
Source: Barchart.com
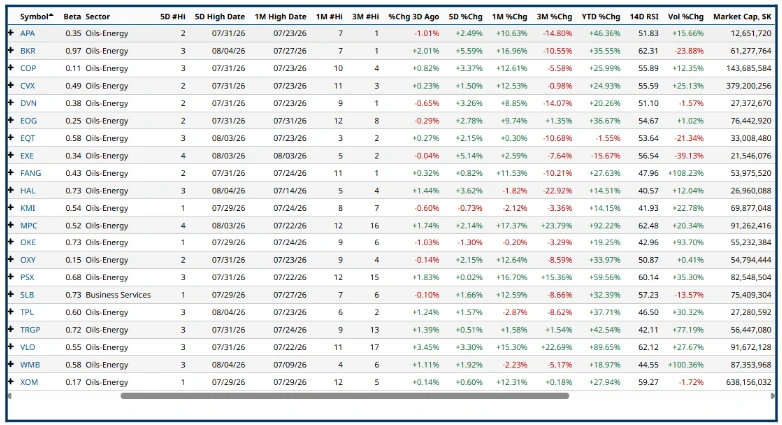
Here are the same stocks in the week of August 3rd 2026:
Source: Barchart.com
Two things stand out immediately: firstly, that the stocks have nearly all posted significant year-to-date gains, which to some extent validates my theory that the sector was overdue for a bounce.
The second point is that the stocks' betas have changed dramatically. For example, in our original list, APA Corp APA has a beta of 1.16, but in the update to date table that has shrunk to 0.35
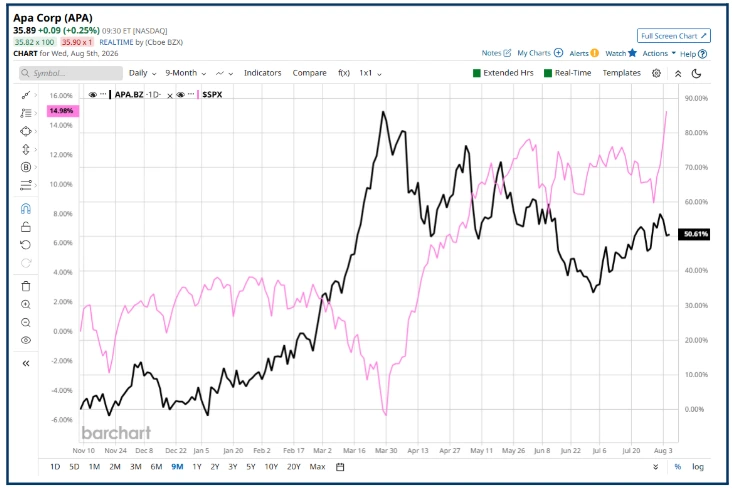
If we plot APA Corp against the S&P 500 over the last 9-months (see the chart below), we can see that the change plays out in the closing months of 2025. APA and the index are moving in a similar direction at the same time; however, that changes dramatically with the start of the Iran war as the price spikes higher on rapidly rising oil prices, generating significant percentage price gains.
If we move to the present day, we can see that the index and the APA stock price are moving in different directions as the index rallies on a recovery in technology-related stocks - the oil price is no longer the dominant narrative in the market.
Source: Barchart.com
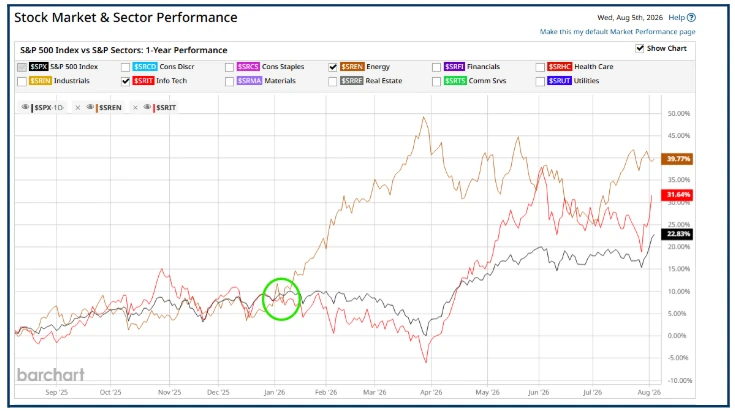
However, it wasn't just the war; in the chart below, I have highlighted the point at which Energy stocks broke out relative to Technology, and the S&P 500 Index, which happened in January, well over a month before hostilities commenced.
Source: Barchart.com
The information provided does not constitute investment research. The material has not been prepared in accordance with the legal requirements designed to promote the independence of investment research and as such is to be considered to be a marketing communication.
All information has been prepared by ActivTrades (“AT”). The information does not contain a record of AT’s prices, or an offer of or solicitation for a transaction in any financial instrument. No representation or warranty is given as to the accuracy or completeness of this information.
Any material provided does not have regard to the specific investment objective and financial situation of any person who may receive it. Past performance is not a reliable indicator of future performance. AT provides an execution-only service. Consequently, any person acting on the information provided does so at their own risk. Forecasts are not guarantees. Rates may change. Political risk is unpredictable. Central bank actions may vary. Platforms’ tools do not guarantee success.