
I often refer to moving averages in my articles, but I don't necessarily explain what they are and why I think they are important to traders. So let's try to put that right today.
Moving averages are used to smooth out data and remove the noise from time series information, which, of course, makes them ideally suited to charting and trading.
In a trading context, moving averages allow us to see how a price has performed over a period of time, be it 10 days, 1 month, or 1 hour. What makes them especially useful in this context is that they are calculated on a rolling basis, updating every hour, month or 10-day period. In fact, they are updated over any time frames that your charting system allows you to select.
Calculating a moving average is pretty simple:
For example, to calculate a 5-day moving average, we simply add the closing prices of the instrument over the last 5 days together and then divide that number by 5.0.
5 Day MA = p1+p2+p3+p4+p5 / 5
If we want to calculate a 15-day MA, we simply add the previous 15 days' worth of prices together and divide by 15, and so on.
Once we have calculated a moving average, we can apply it to a price chart, and once that’s done, we are in a position to assess how a stock is performing relative to that moving average.
The good news is we don't need to use our calculator or paper and pencil for this because moving averages are calculated for us by modern charting software and systems.
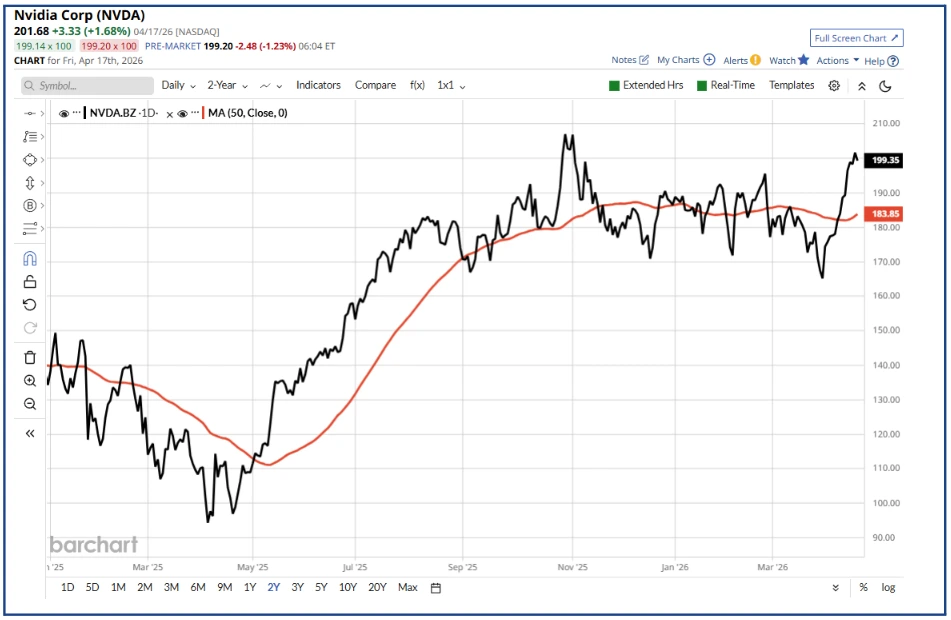
In the chart below, we can see Nvidia in black, overlayed by its 50-day moving average in red.
Nvidia's move back above the 50-day MA line in recent weeks could be seen as a bullish signal.
Source: Barchart.com
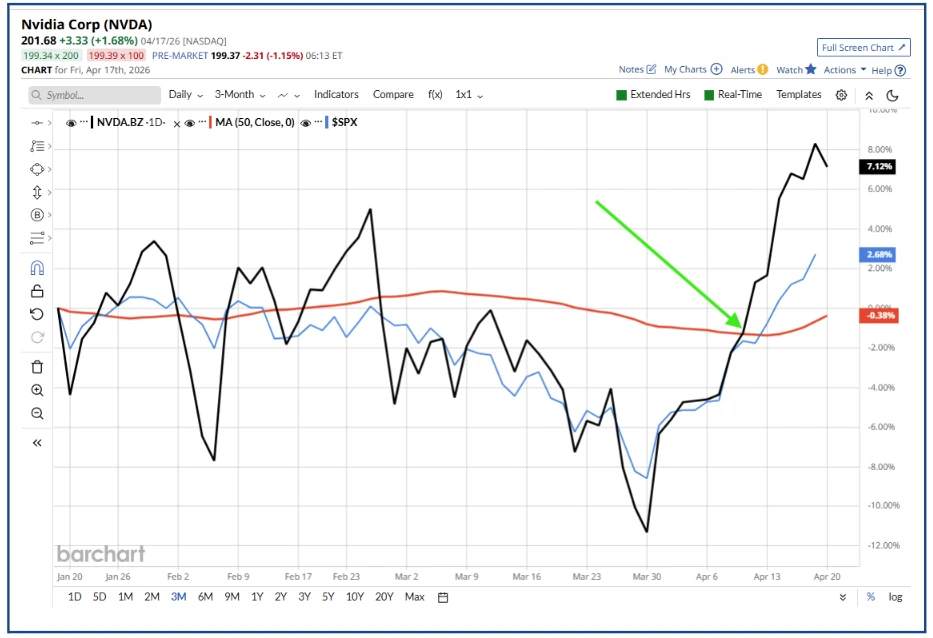
In our second chart, I have added the S&P 500 index in blue.
We can see that the index has rallied in line with NVDA US in recent weeks, though if we look at the percentage performance of the two, Nvidia has comfortably outperformed the index, which has recently posted new all-time highs or ATHs.
Is that an omen for further gains in the index?
Source: Barchart.com
Types of moving averages
There are three common types of moving averages:
Simple Moving Average, or SMA, is the most straightforward and commonly used MA. Each price in the MA calculation is given the same weighting, or, in fact, no weighting at all. The value of the SMA reflects the mean average price of the instrument under observation over the specified time period.
Exponential Moving Average or EMA. The Exponential Moving Average weights the most recent prices to put more emphasis on what's happening now rather than what happened in the past. It does this by using what's known as a smoothing factor.
The maths behind that weighting calculation is more complicated, but we don't need to worry too much about that because our charting system does the sums for us.
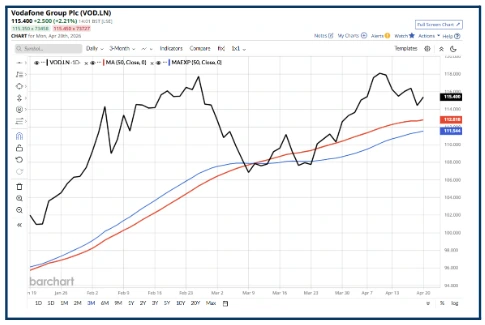
Here is Vodafone VOD LN with its 50 D SMA line in red and its 50 D EMA line drawn in blue. Vodafone’s price has been drifting lower of late, and the EMA line reflects that and is at a lower level than the SMA line.
Source: Barchart.com
Weighted Moving Average or WMA is similar to the EMA in that the WMA also weights current prices over historical, each price in the period being measured is weighted, with the highest weighting given to the most recent observation, and the lowest weighting is given to the oldest. The prices are then multiplied by their weighting, summed and then divided by the number of periods observed.
Weighted moving averages are good at focusing on the here and now, but they can also create a lot of noise that you don’t tend to get with the EMA, which uses a more dynamic weighting process.
Combining different periods
Moving averages can be used in a variety of ways, but one of the most popular is to use them as a momentum indicator, which can inform traders about what's happening in the price action.
This is done by pairing two or more MA lines together. Typically, a shorter term faster moving (updating) line is paired with a slower-moving, longer-term MA line.
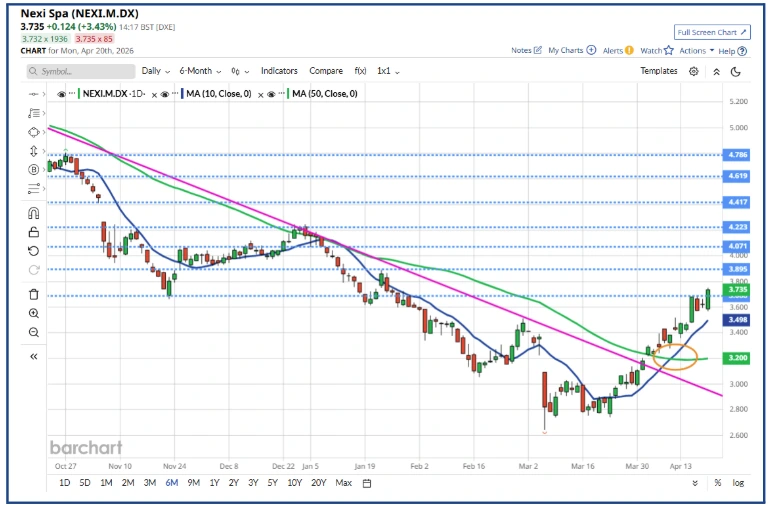
The chart below is a 6-month candle chart of Nexi NEXI MI, an Italian-listed online payments and processing company.
If you look to the bottom right of the chart, you can see that the 10 D MA line in dark blue crossed up through the slower-moving 50 D MA line in green, which is still hedging lower.
That’s known as an MA crossover, and in this case, it's bullish and signalled that near term momentum was changing in the stock from the downside to the upside.
Remember that the 10 D MA line is updated 5 times more frequently than the 50 D MA, which is every 10 periods rather than every 50.
Note how the 10 D MA stopped going down, flattened out and then started to move higher ahead of the MA crossover. That was a precursor to the trend change.
Source: Barchart.com
Also note that the 10 D MA line is acting as support for the move higher that the Nexi share price is experiencing.
These are signals that are generated by the market/price action that traders can use to their advantage. Whether that's in highlighting new opportunities, trend changes, confirmation of a trade entry, or stop loss placement.
The information provided does not constitute investment research. The material has not been prepared in accordance with the legal requirements designed to promote the independence of investment research and as such is to be considered to be a marketing communication.
All information has been prepared by ActivTrades (“AT”). The information does not contain a record of AT’s prices, or an offer of or solicitation for a transaction in any financial instrument. No representation or warranty is given as to the accuracy or completeness of this information.
Any material provided does not have regard to the specific investment objective and financial situation of any person who may receive it. Past performance is not a reliable indicator of future performance. AT provides an execution-only service. Consequently, any person acting on the information provided does so at their own risk. Forecasts are not guarantees. Rates may change. Political risk is unpredictable. Central bank actions may vary. Platforms’ tools do not guarantee success.