
Support and resistance are phrases that are often used in commentary on the markets, particularly if the commentator makes use of technical analysis, or is a student of price action. I fall into both of those groups and regularly reference these concepts in my articles and posts.
But what exactly are Support and Resistance levels in the context of trading?
Support and resistance levels are visualisations of price and price action; they reflect specific price points or areas, where the price action of an instrument has changed or deviated from its existing path.
For example, a stock price could pause in, or start to reverse, an existing trend, at a given price level or area, within the current price range.
In the chart below, we see Soitec SOI FP, which makes the substrates on which silicon chips are printed.
The stock has rallied by +326.0% year to date, but on the 15-day, hourly chart, below, we see that the price has hit resistance at/around €113.43.
I have drawn a dashed line in blue to represent the resistance level.
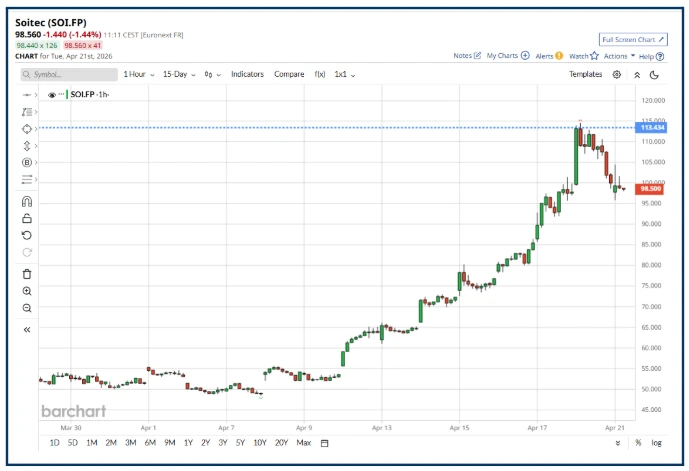
Source:Barchart.com
If we extend the Soitec chart out to just over 2 years (see below), we find that this level has cropped up before.
Indeed, it acted as a resistance in late August 2024, and notably, the failure to break above that line. marked the start of a sell-off in the Soitec share price, which took it all the way down to €22.60.
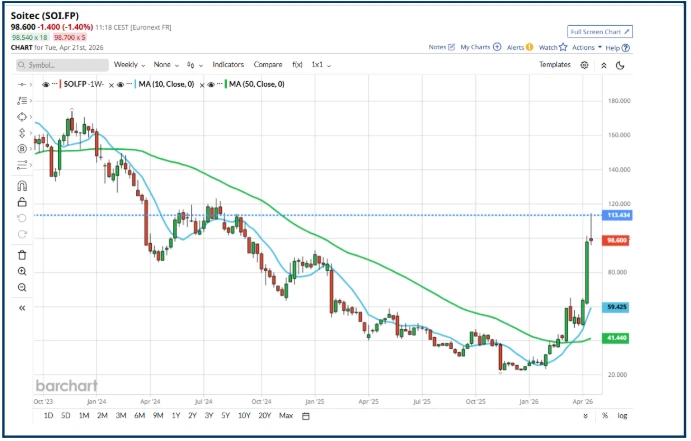
Source:Barchart.com
Bigger Picture
On the short-term chart, the resistance level was just a point in Soitec's price history without any real context beyond that.
However, by increasing the time frame of our chart, we discovered that the level had resonance and had been a material turning point in the stock price historically.
Interestingly, I picked Soitec as an example because it has had such a strong run in 2026; however, until I drew the charts, I wasn't aware of the significance of €113.43 in the historic price action.
And that illustrates how effective and informative a resistance level can be.
Of course, we can’t know for definite that this resistance level marks the top of the recent run in Soitec, but the fact that it stumbled here before gives us cause to consider the possibility of a downside move from here.
What’s more, we now have a level against which to test any subsequent upside move in the stock.
We can also see a support level in the Soitec chart, which formed the bottom from the late August sell-off, referenced above.
I have drawn a pink dashed line to highlight this area on the chart, which comes in around €20.98
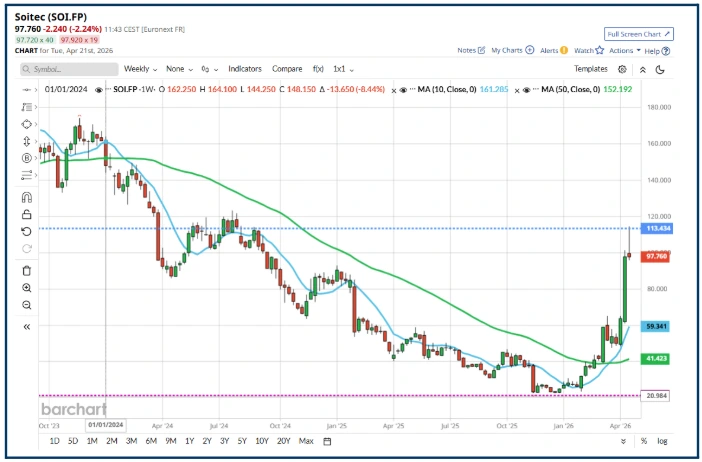
Source:Barchart.com
Here is a great example of a support level, in this case, in Nvidia NVDA US.
Actually, there are two levels in proximity to each other (see the pink dashed lines below), the lower level $164.49 has been the low on three separate occasions, from which the stock rallied in all three cases.
When people say that markets have a memory, this is what they have in mind.
Of course, the market doesn't remember a particular price level, but the participants within the market do.
And that's why support and resistance levels are of use, because they reflect the collective psychology and sentiment of the traders in the market, at a particular price level or area.
That’s especially interesting if that’s the price where we see a trend change, which is where sellers turn into buyers, or buyers turn into sellers.
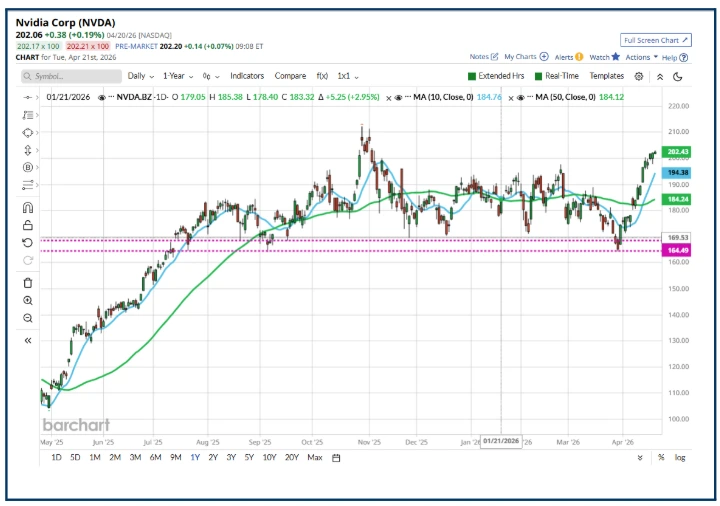
Source:Barchart.com
Trend Support
So far, we have looked at Horizontal Support and Resistance, but there is another flavour, and that is Trend Support and Resistance.
I have highlighted the recent uptrend in Nvidia, in black, in the chart below.
In an ideal world, this trend line would connect with all of the low points on the candles in the Nvidia rally.
Of course, life is rarely perfect, and so what we see here is that Nvidia tested below the line in early April; importantly, however, it finished the day above it and hasn't tested below it since.
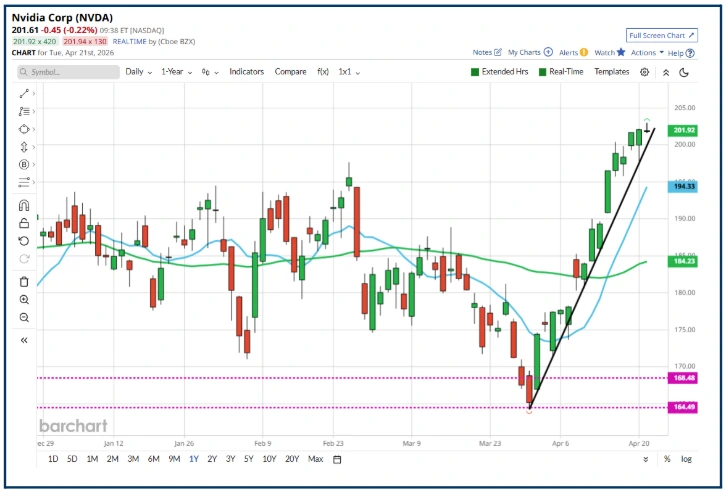
Source:Barchart.com
What we are looking at is consistency or continuity in the price action, which forms a trend, in this case an uptrend, the lower edge of which is traced by the trend support line.
Support and resistance lines occur because the market is in a continuous state of flux, with traders entering and exiting positions all the time. If you looked at those as individual trades. It would seem to be just a jumble of numbers, but once the trades have been collated and sorted into a time series data, which can be plotted on a chart, patterns become observable.
Those patterns contain information that traders can and should use to their advantage.
The information provided does not constitute investment research. The material has not been prepared in accordance with the legal requirements designed to promote the independence of investment research and as such is to be considered to be a marketing communication.
All information has been prepared by ActivTrades (“AT”). The information does not contain a record of AT’s prices, or an offer of or solicitation for a transaction in any financial instrument. No representation or warranty is given as to the accuracy or completeness of this information.
Any material provided does not have regard to the specific investment objective and financial situation of any person who may receive it. Past performance is not a reliable indicator of future performance. AT provides an execution-only service. Consequently, any person acting on the information provided does so at their own risk. Forecasts are not guarantees. Rates may change. Political risk is unpredictable. Central bank actions may vary. Platforms’ tools do not guarantee success.