On the face of it, trading equities should be a relatively simple matter no?
Just a case of turning on the trading screen or app and picking a stock to buy or sell, and then closing the position as and when you have made a big enough profit, or have been stopped out.
And if you are a natural stock picker, then this kind of almost casual discretionary approach might work for you. However, the truth is that systematic strategies tend to be the most effective in the financial markets over time.
After all, there are around 5500 listed stocks in the US, some 6000 across Europe, and another 1900 here in the UK, to say nothing of Asia Pacific and Latin America too.
That's far too many to be able to keep track of. If you took just one minute to look at the charts of all of US or European equities you would be there for 5 days solid.
That’s not a tenable approach.
What we need to do is cut down the universe of stocks that we monitor or look at
So for example what if we took a group of stocks such as the S&P 500 names and then filtered that list for stocks that trade under $150.00 a share? Well, that gives us a list of 293 stocks to consider.
If we take the price filter to <$100.00 we get a list of 210 names, and if we reduce the filter further to $50.00 per share, the list shrinks to just 84 names.
FYI a 75.00 dollar limit returns 155 stocks.
I am sure you get the idea.
A list of just over 80 names is manageable I would suggest
However, an arbitrary share price filter is a pretty blunt selection tool and says nothing about any of the other qualities of the stocks in question.
Now as traders, we don't need to know the fundamental details of every stock we monitor, in the same way an investor would.
However, I have found that you do become familiar with the stocks you trade and analyse over time.
If nothing else they tend to move when new information about them hits the market. Whether that's around earnings, new contract wins, broker research or M&A speculation.
As an equity trader, there are a different set of data points about stocks that you should be aware of, and familiar with.
I have listed some of the fields below that I think matter most to equity traders.
Volume/Liquidity
Trading is all about buying and selling freely, the last thing that any trader wants is to be stuck in a position they can't exit, particularly one that’s going against them.
One of the best ways to avoid that is to only trade in liquid stocks, that is stocks where you can buy or sell your lot size immediately in the normal course of events.
Liquidity can vary due to market conditions but daily average volumes are a good guide particularly if they are measured over a longer period of say three or six months.
What you are looking for are stocks that have a consistent turnover of shares and ideally one that’s rising too because volume is one of the best indicators for confirmation of a trading opportunity.
Volatility
We hear a lot about volatility and the conversation is often attached to discussions about options markets and quite complex maths much of which we can ignore. Volatility is a measure of how much a price has or is expected to move over a period of time. It’s often expressed as a percentage the higher the percentage then the higher the likelihood of a sharp price move.
Volatility is a double-edged sword for traders because they want to trade stocks whose prices move around but they want to trade stocks whose prices move predictably. Volatility and predictability are often the inverse of each other.
And the best that even the options maths, that calculates volatility levels can do is tell us that there is a chance of an “ X” percent move in a market without being able to identify which direction the price will move in.
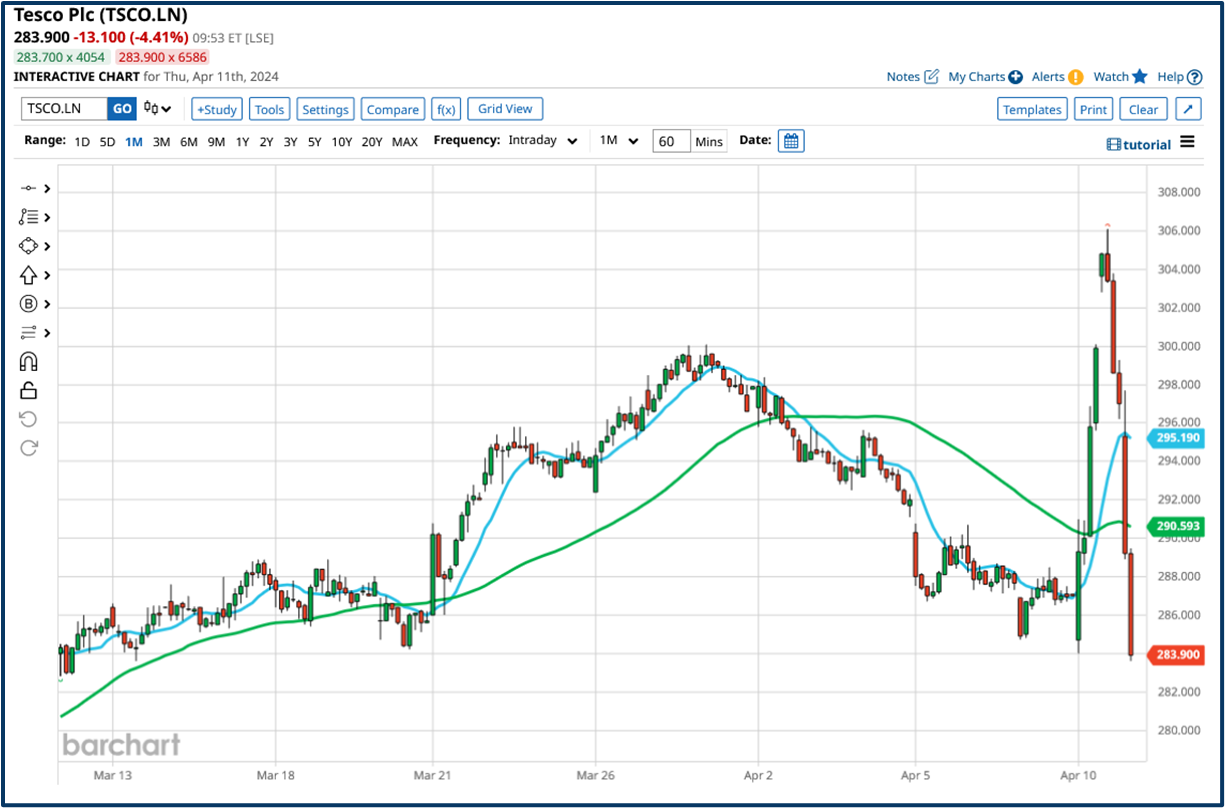
Let's look at some examples first of all UK grocer Tesco (TSCO LN ) whose price jumped sharply on April 10th as it sold its banking business and announced a £1.0 billion share buyback.
Note the bullish engulfing pattern, the first green candle on the 10th signalled a larger move was possible.
Tesco wouldn’t normally be considered a volatile stock but as we can see the share price reversed its gains the following day.
Note the high wave candle that opened the session on the 11th and which signalled that a reversal was possible.
At the other end of the spectrum is Nuscale Power SMR US. A start-up which hopes to build small modular nuclear reactors across the US and further afield.
This stock is considered to be highly volatile and indeed it has traded below $4.00 and above $10.90 in recent weeks.
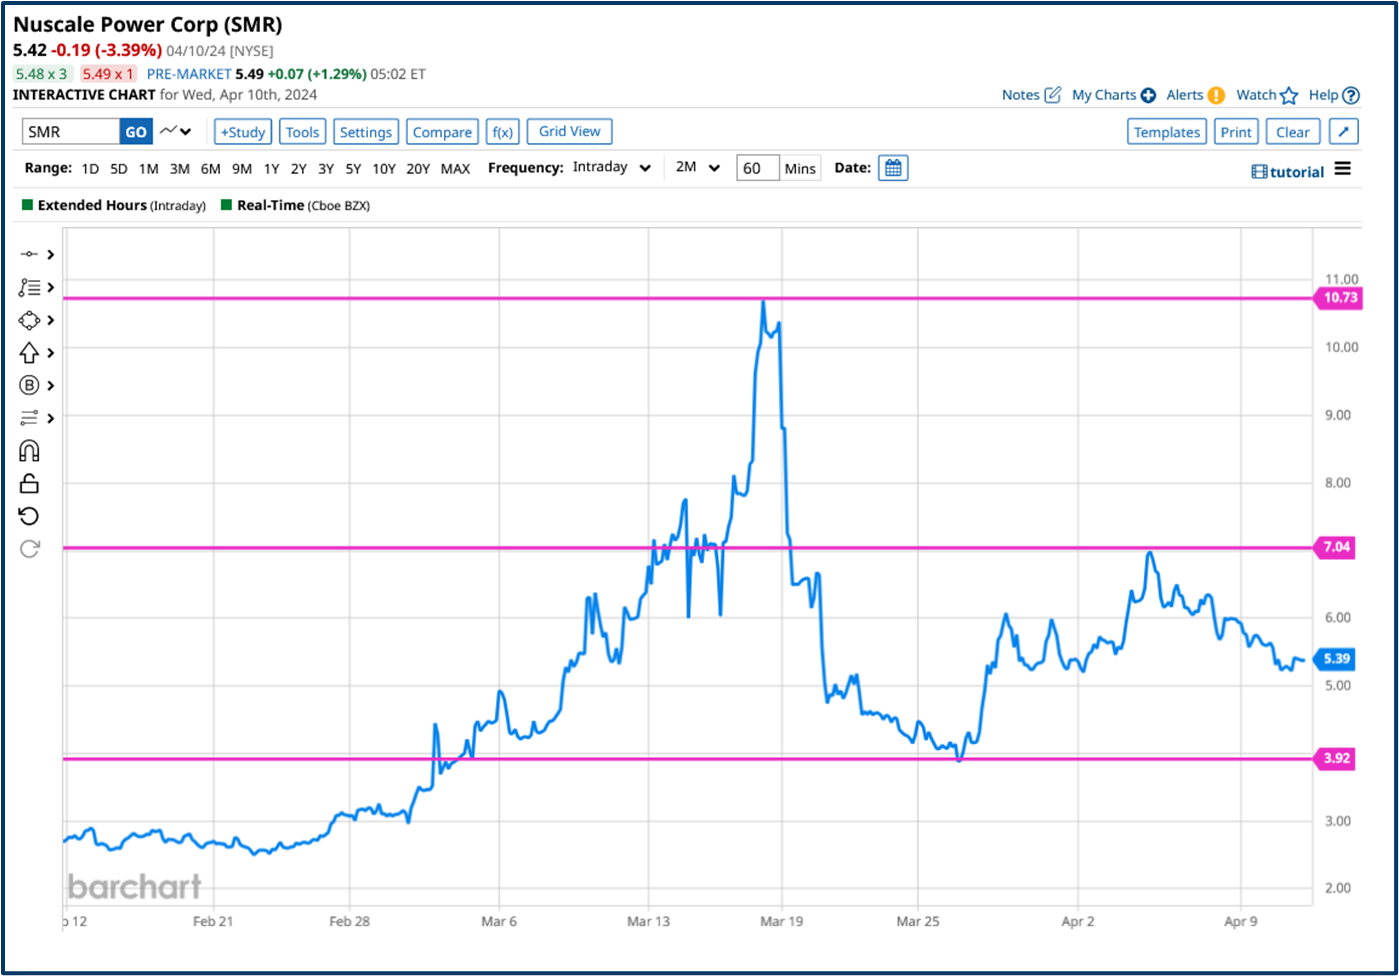
A good rule of thumb is that stocks that are driven by sentiment such as Nuscale, rather than tangibles like earnings, such as Tesco tend to be the most volatile.
Alpha/Beta
Stock Beta
Beta measures the reaction of a stock relative to the overall market. A stock with a beta of 1.0 is as volatile as the market, a stock with a beta of 2.0 is twice as volatile as the market, and a stock with a beta of 0.5 is half as volatile as the market.
Stock Alpha
Stock alpha measures the excess return of a stock over and above what would be expected based on its beta. A stock with a positive alpha can be thought of as outperforming the market, while a stock with a negative alpha is underperforming the market, or put another way the stock is moving for reasons of its own.
High beta stocks are more reactive and traders will often favour those when trying to capture or leverage a market move.
Traders will often look to alpha to implement hedges or to shield themselves from index or sector moves.
Hegde funds and other sophisticated market participants often engage in trying to capture alpha to produce outperformance and uncorrelated returns.
In summary then, pick a stock universe that you can comfortably track, and get to know the characteristics of the stocks within it. get familiar with the betas and things that move the stock prices.
The ranges that they typically trade within, and what an average daily move and volume looks like for these stocks.
Knowing what’s ordinary and mundane means you will be able to quickly recognize the out-of-the-ordinary when it occurs.
See Tesco above as an example of that.
The information provided does not constitute investment research. The material has not been prepared in accordance with the legal requirements designed to promote the independence of investment research and as such is to be considered to be a marketing communication.
All information has been prepared by ActivTrades (“AT”). The information does not contain a record of AT’s prices, or an offer of or solicitation for a transaction in any financial instrument. No representation or warranty is given as to the accuracy or completeness of this information.
Any material provided does not have regard to the specific investment objective and financial situation of any person who may receive it. Past performance is not a reliable indicator of future performance. AT provides an execution-only service. Consequently, any person acting on the information provided does so at their own risk.