
Relative Strength and Rising Tides
There is an old equity market saying that says: “A rising tide lifts all ships”
It implies (quite correctly) that a bullish equity market will push the majority of stock prices higher, in the same way that an incoming tide lifts moored boats and ships off the seabed.
We can think of index trading as trading the tides of the market, with traders responding to bullish and bearish influences on sentiment, at a macro and or geopolitical level.
And if we stay with the maritime analogies, then trading stocks is akin to being in a yacht race that starts when the tide comes in.
Whilst a rising tide lifts all seaworthy ships equally, the market treats individual stocks differently.
An equity trader's role is to identify stocks that receive special treatment, whether that’s bullish or bearish.
In fact, trying to identify stocks that are likely to outperform on the upside, or the downside, takes up a good chunk of my time each day.
Hopefully, this is time well spent, because if we can identify those stocks, then there is a good chance that we could craft a successful trade around them.
To try to identify stocks that could outperform, I like to use comparisons.
Comparing stocks to their peers at an index, sector, or broad market level means that we can start to categorise them and then identify those that stand out from the crowd.
Those that are exhibiting relative strength compared to the rest of the group.
When I talk about relative strength in this context, I am not referring to the RSI 14 Indicator but rather to the relative performance in the price action of one stock versus another stock, or a group of stocks.
For example, here is a list of NASDAQ 100 stocks ranked by the number of new 1-month highs the stocks have posted (descending order ). The idea being that stocks that are frequently posting new 1-month highs are likely to be rising in value, and doing so quite aggressively.
Marvel Technology MRVL and Monolithic Power are at the top of this list; both have 16 new 1-month highs, respectively.
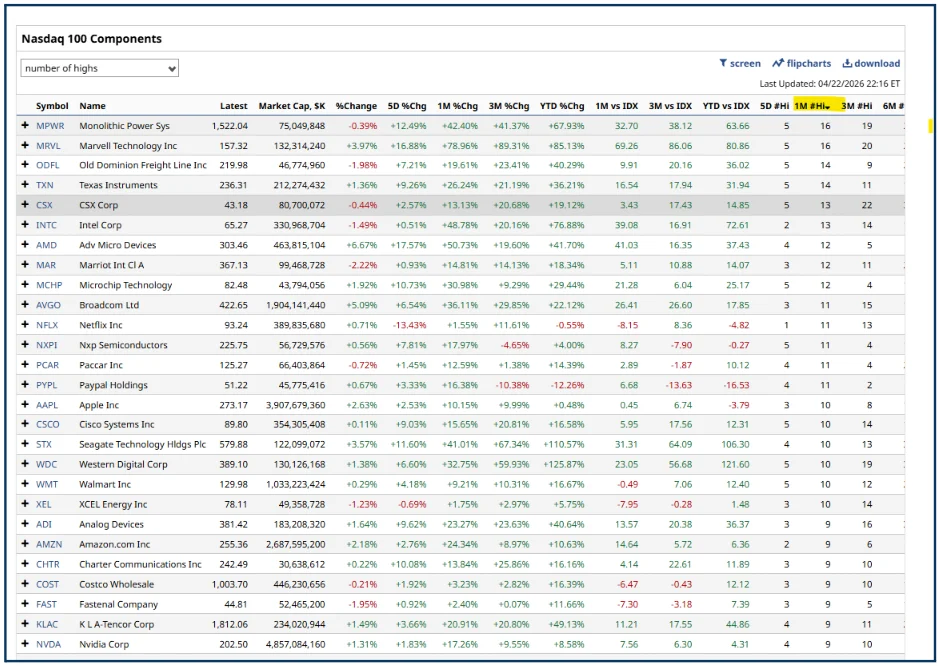
Source: Barchart.com
However, here is the same table, but this time it's sorted by a stock's performance, year to date, relative to the S&P 500 index; once again, it's sorted in descending order.
Notice that different stocks are at the top of the table now, and that they are stocks that were much further down this list when it was ordered by the number of new 1-month highs.
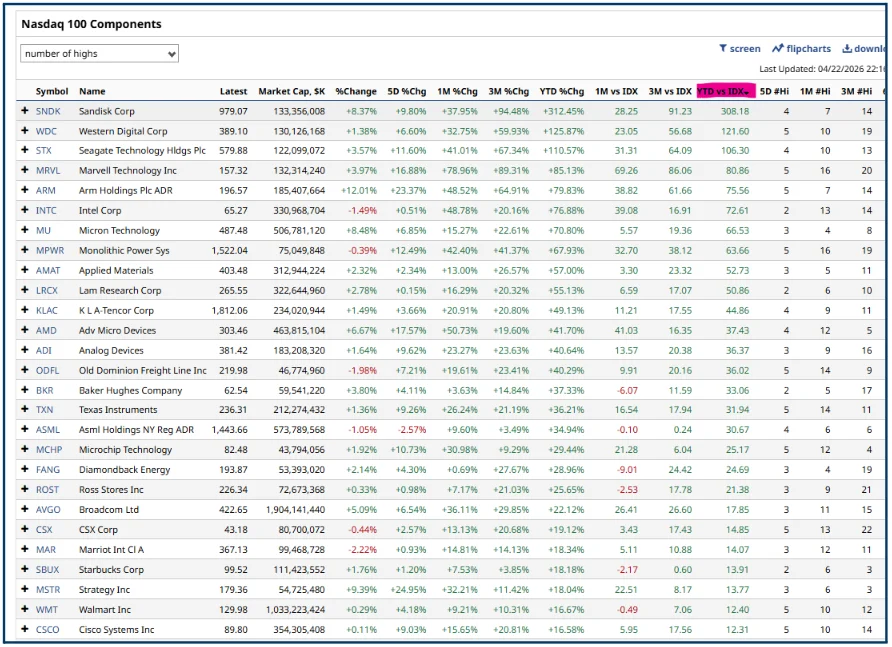
Source: Barchart.com
What that demonstrates is that there are various moving parts when it comes to assessing the relative strength of a stock versus its peers.
However, Marvel Technology is in the top 4 names in the latter view, so it's scored highly on both measures.
Looking at a year-to-date line chart of MRVL, we can see that it broke out in two stages, which effectively bookended March 2026.
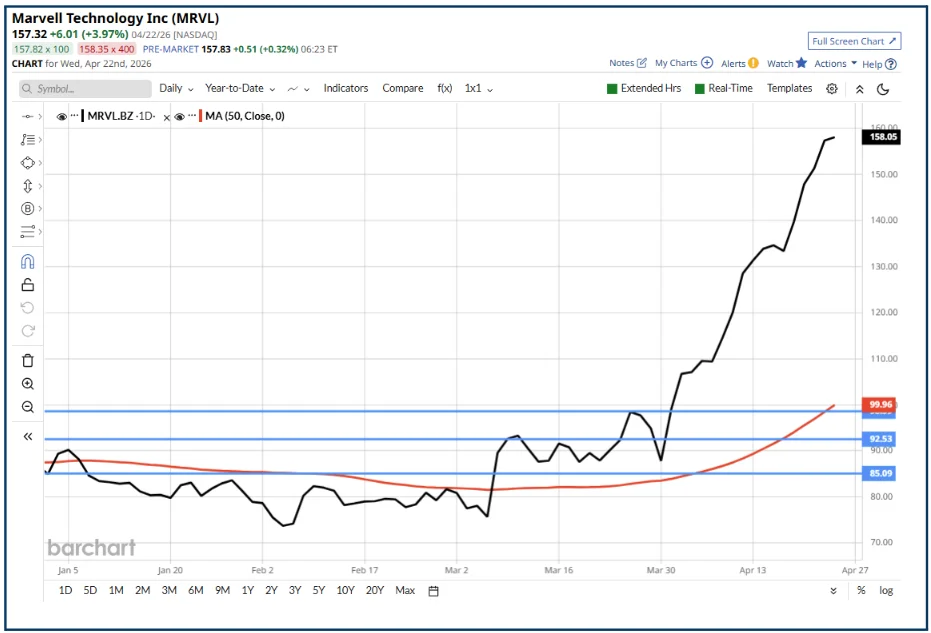
Source: Barchart.com
The chart below shows the correlation between the number of 1-month highs and the relative performance of the Nasdaq 100 stocks, year to date, versus the S&P 500 index.
The numbers tell us that there is a positive relationship between these two variables, but it isn't set in stone.
The blue dot in the centre of the chart is Sandisk SNDK US, which has only posted 7 new 1-month highs, but which has outperformed the S&P 500 by more than 300.0%
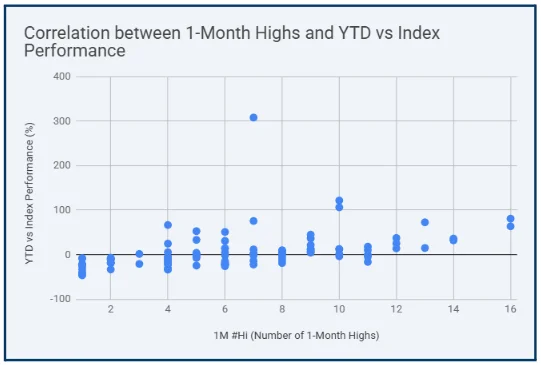
Source: Barchart.com Darren Sinden
What we have done so far is largely backwards-looking, as we have used year to date and 1-month metrics to sort through our stock list.
We have found stocks that stand out from their peers, but they have already had a good run.
That doesn't mean they can't run further, but wouldn't it be good to find something that was still full of potential?
To do that, let’s look at stocks with a high number of new 5-day highs and which are up over 5 days.
Here are some S&P 500 stocks that meet those criteria:
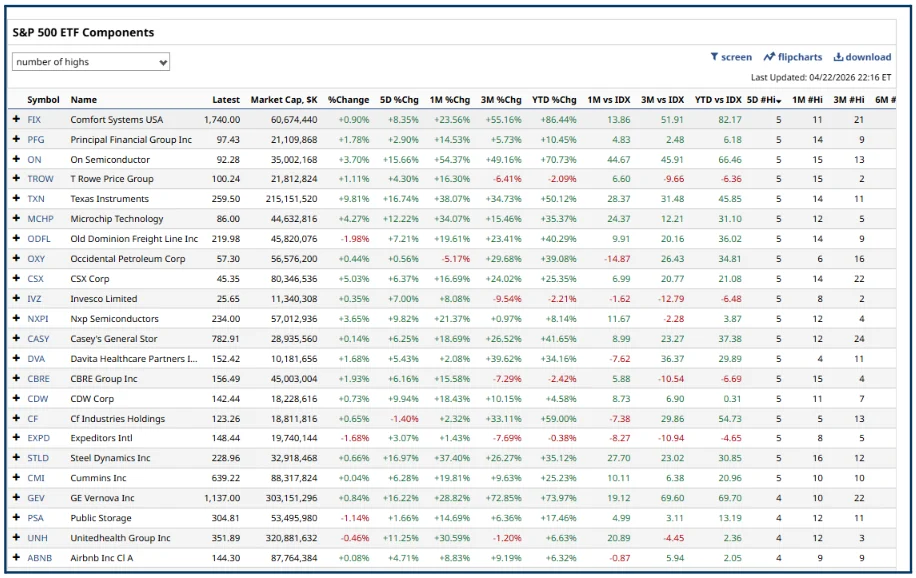
Source: Barchart.com
One stock that fits that bill is PFG US Principal Financial Group Inc. You can see on the chart below that it’s testing towards its all-time high at $97.88, above which, it could be blue skies all the way for the stock.
PFG is due to report earnings after the market closes on 23-04-2026.
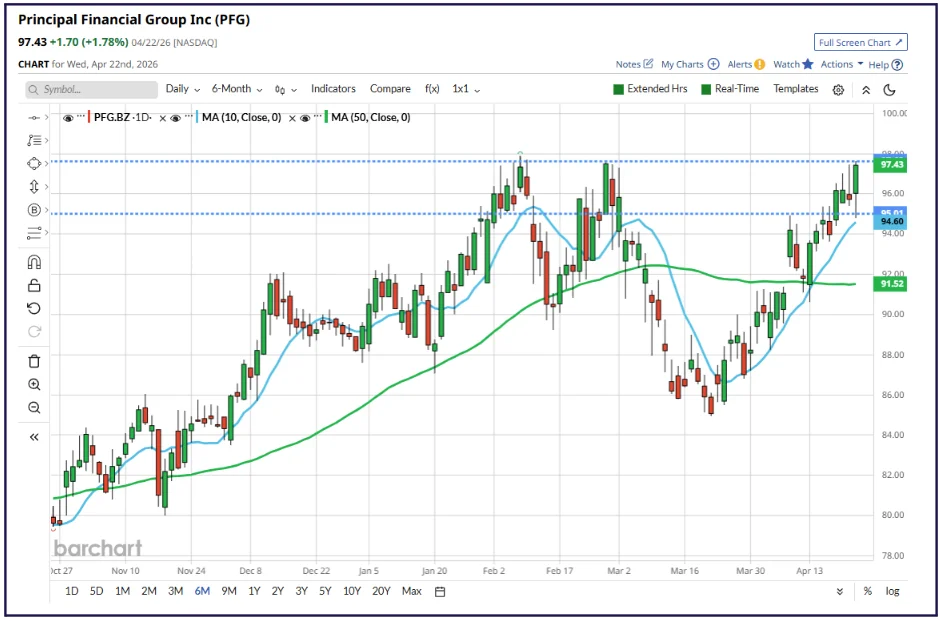
Source: Barchart.com
But imagine if we had run these studies or something similar to them earlier in the month. We could have identified Texas Instruments TXN US, which posted 14 new highs over the last month and 5 over the last five days. Looking at the HLOC data (below) since the end of March, there have been 3 times as many winning days as losing.
Texas Instruments HLOC data
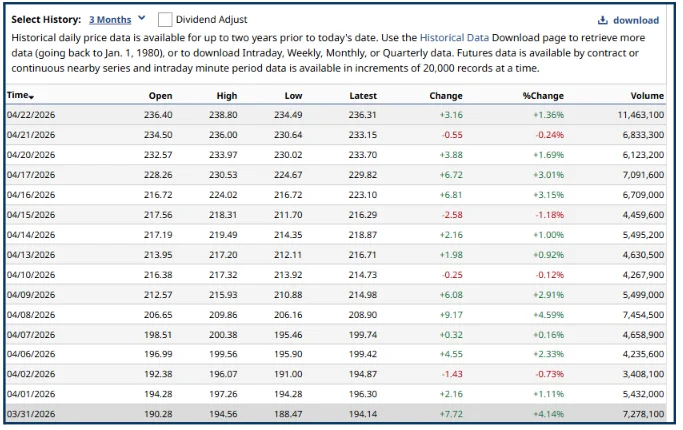
Source: Barchart.com
That's a sure sign of upside momentum that was reflected in the stock’s earnings release, in which it beat consensus and raised guidance. The net result was a +15.6 % rise soon after the open on Thursday, 23-04-2026. See below.
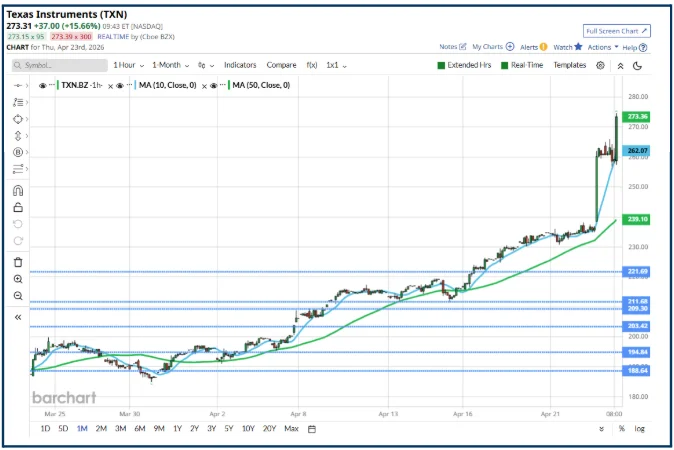
Source: Barchart.com
Hopefully, this article has shown how you can find and compare a stocks relative performance with other stocks and peer groups, and how that process can identify trading opportunities.
The data is out there, and the numbers rarely lie.
The information provided does not constitute investment research. The material has not been prepared in accordance with the legal requirements designed to promote the independence of investment research and as such is to be considered to be a marketing communication.
All information has been prepared by ActivTrades (“AT”). The information does not contain a record of AT’s prices, or an offer of or solicitation for a transaction in any financial instrument. No representation or warranty is given as to the accuracy or completeness of this information.
Any material provided does not have regard to the specific investment objective and financial situation of any person who may receive it. Past performance is not a reliable indicator of future performance. AT provides an execution-only service. Consequently, any person acting on the information provided does so at their own risk. Forecasts are not guarantees. Rates may change. Political risk is unpredictable. Central bank actions may vary. Platforms’ tools do not guarantee success.