
In trading, gaps are voids in the chart, or price action; they represent an area where no trading has taken place, an empty space on the chart that seemingly contains little or no information, or does it?
Gaps are classified into three main types:
- Breakaway gaps can signal the start of a new move.
- Continuation gaps that can reinforce an existing trend
- Exhaustion gaps, which can warn traders that a trend is changing/ending
Gaps occur most frequently in the market that close that than trading 24 hours per day, they can occur daily in equity and the following weekend in markets like Forex.
Gaps can also occur intraday, when there is new information, such as earnings releases, macroeconomic data or geopolitical news.
As is the case with most technical analysis, maximising the potential of gaps in a chart depends on the ability of the viewer to interpret the signals.
Sometimes the market makes what's going on pretty clear
For example, the series of gaps in the ON Semi (ON US) chart from early April (see below) clearly indicated ongoing upside momentum.
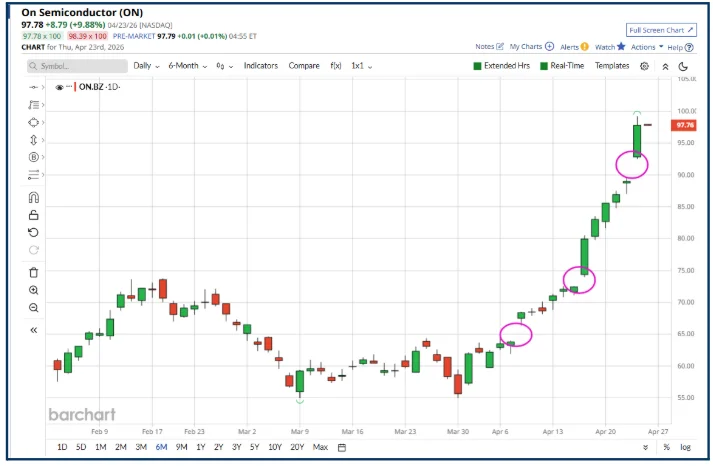
Source:Barchart.com
If we draw the On Semi chart again, and this time include the 10 and 50 D MA lines, you can see how the initial gap, and the MA crossover,10 D up through the 50 D, combine to give a powerful signal about which direction the price is heading in.
Subsequent gaps showed us that the price was continuing to climb.
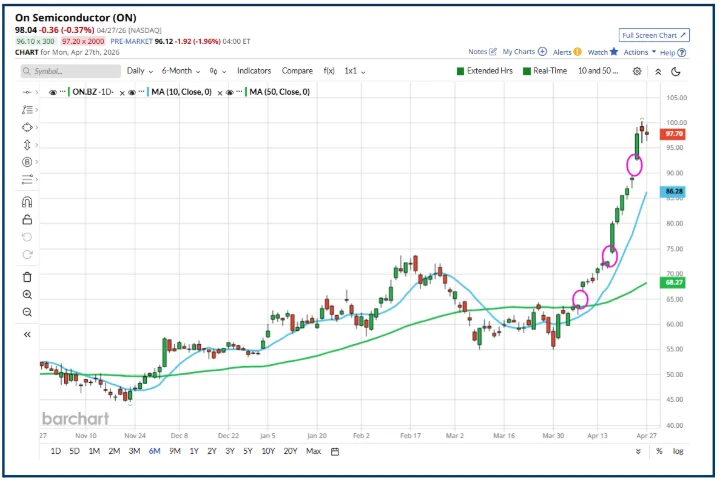
Source:Barchart.com
When you see a set-up like this, the buyers are in control, and the sellers have stepped to the sidelines, creating the gaps.
Sellers enter the market again above the gap levels, but are quickly taken out, and the price tries to find a new equilibrium at a higher level still.
However, each time it does this, demand (buyers) exceeds supply (sellers), and so the price rises once more.
Of course, not every chart with gaps will be as clear-cut as ON Semiconductor’s
Take a look at this chart of Tesla TSLA US, which is littered with gaps.
In this instance, I’ve shown up-side gaps in blue and downside gaps in pink.
My observations here are that, on this evidence, the Tesla price initially tends to move in the same direction as the gap, but the price changes are not always significant or long-lasting.
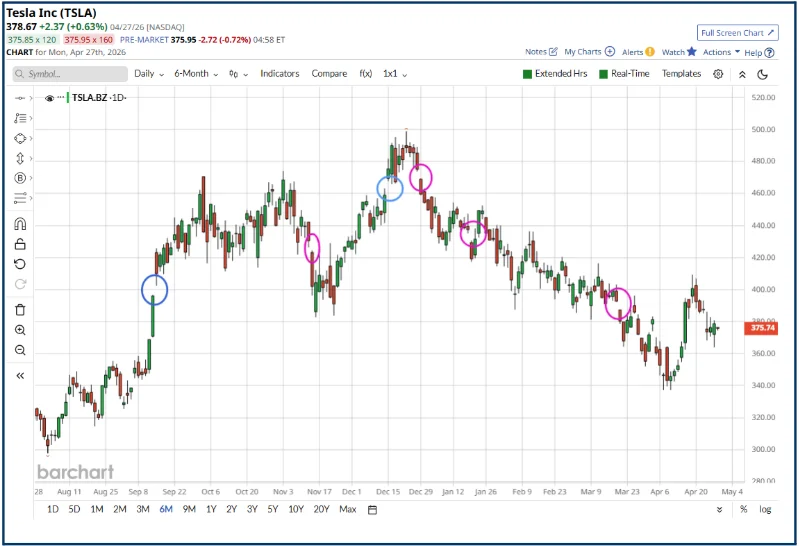
Source:Barchart.com
If we zoom in to mid-March (see below) we see a downside gap, in which the Tesla price opens below and away from the prior close, see the pink ellipse.
The stock moves down for two sessions, but then the price starts to reverse course, see the blue arrow.
On the third day, it fills the gap above, see the orange arrow and the blue dashed line.
However, the Tesla price rejects the move higher and sells off once more, in a short-term downtrend. denoted by the red arrow.
What we are seeing here is more of a contest between the buyers and sellers in Tesla, though neither group appears to have had much conviction at this point. Though the sellers did gain the upper hand for a while.
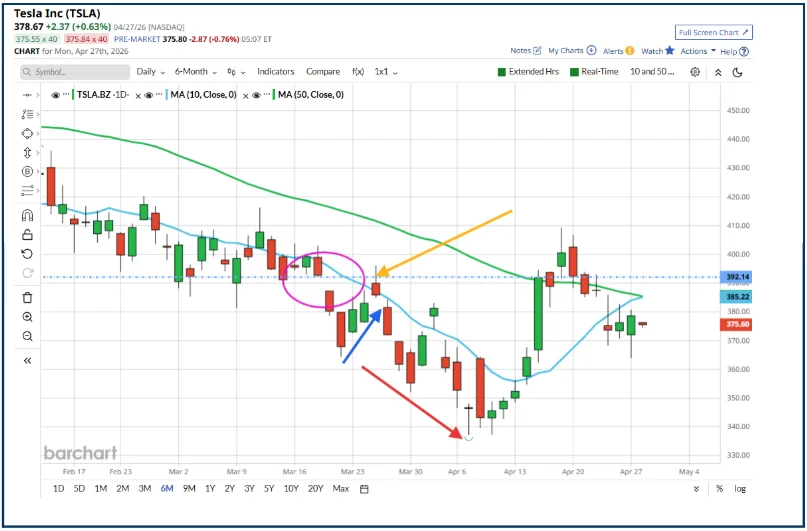
Source:Barchart.com
Do we have to look at charts to benefit from price gaps?
Strictly speaking, the answer to that is no, though it's always a good idea to look at the chart before pulling the trigger on a trade, in my humble opinion.
The table below, which was taken from Barchart, shows large-cap US stocks that gapped higher on Monday, 27 April.
The table is sorted in descending order of percentage change, and the image was taken before the US open on the morning of 28 April.
One way to derive a signal from a table like this is to compare the size of the gap in percentage terms with the stock's percentage change.
Where the percentage change is greater than the gap percentage, you have a situation where the buyers in a stock have been able to take control of the price. And I have highlighted some instances of this in yellow below.
Going long of stocks that move above the gap-up percentage in the regular session could be used as an intraday scalping strategy, for example.
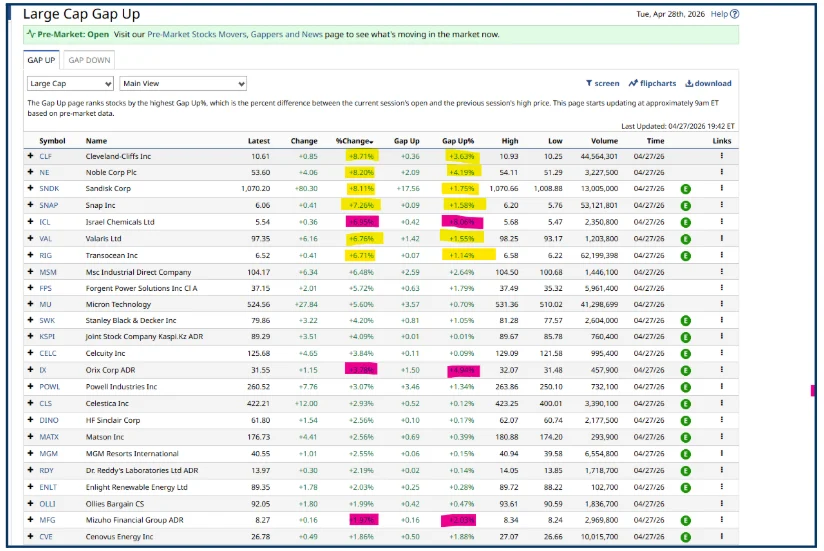
Source:Barchart.com
That won't always be the case, however, and I have also highlighted instances (in pink) where the percentage change on the day is lower than the gap percentage, which tells us that the buyers failed to maintain control of the price.
A good starting point
Gaps in the chart won't necessarily provide us with a trading opportunity, but they can be a very good starting point when we are looking for ideas. Particularly if they combine with and are confirmed by other signals, as we saw in On Semi.
Sometimes, however, we can have too much of a good thing, as we saw in Tesla. And in these circumstances, there can be almost as much noise as there is information.
It's worth taking time to try to confirm how genuine a gap is, and whether there is continuation in the price in the direction of the gap.
Volume can be a useful guide here as well. The greater the volume that accompanies an upside or downside gap, the more conviction it likely has. Though, as always, we still need to look out for the exceptions and the sharp reversals that can accompany them.
The information provided does not constitute investment research. The material has not been prepared in accordance with the legal requirements designed to promote the independence of investment research and as such is to be considered to be a marketing communication.
All information has been prepared by ActivTrades (“AT”). The information does not contain a record of AT’s prices, or an offer of or solicitation for a transaction in any financial instrument. No representation or warranty is given as to the accuracy or completeness of this information.
Any material provided does not have regard to the specific investment objective and financial situation of any person who may receive it. Past performance is not a reliable indicator of future performance. AT provides an execution-only service. Consequently, any person acting on the information provided does so at their own risk. Forecasts are not guarantees. Rates may change. Political risk is unpredictable. Central bank actions may vary. Platforms’ tools do not guarantee success.