
I am often asked how I come up with my trade opportunities and ideas.
I think the best way to answer that question is to run through a recent example and break it down.
So here we go
The quotes below are time-stamped posts from the Idea Factory chat on WhatsApp, which I host every day.
These posts are from 31-03-26
[31/03, 15:28] Darren Sinden: Watching TER US from here:
[31/03, 15:28] Darren Sinden: Niche provider to Chip companies:
Teradyne Inc. is a leading provider of automated test equipment. The company is primarily focused on the semiconductor test market, which generates the bulk of its revenues. It also provides specialised system testing equipment for specific end markets.
Source: Idea Factory chat/Darren Sinden
I timestamp every comment and use stock tickers as IDs when I post. And that way, I can easily look back at my ideas and prior calls. I can also vindicate them to the minute, if needs be.
It's a great way to establish a timeline and a track record.
How Teradyne looked then 31-03-20269
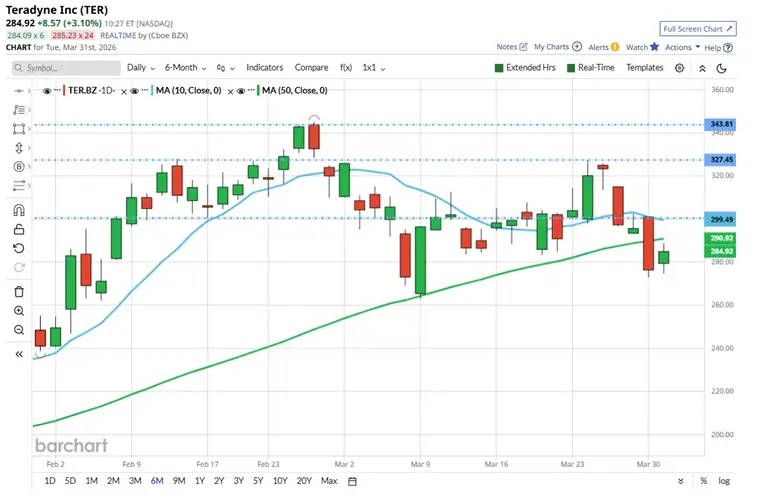
Source:Barchart.com
One week, and $65.00 of upside later, the Teradyne chart looked like this: As I type, they are trading at $366.21.
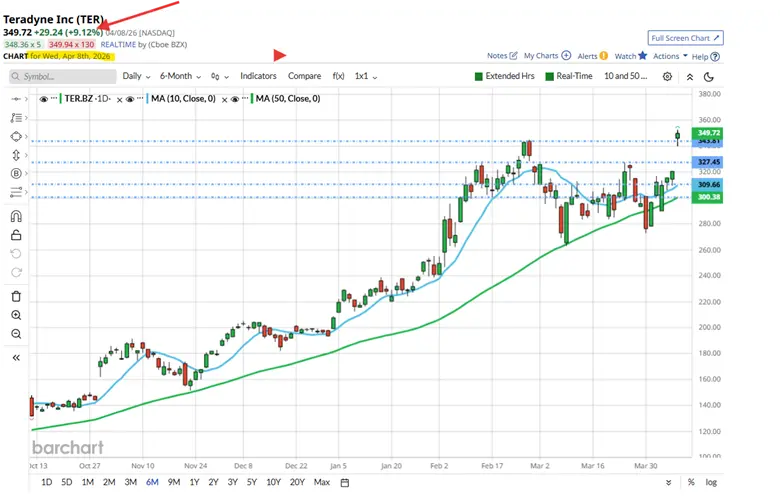
Source:Barchart.com
So, did we get from chart one to chart two? And how was the idea created in the first place?
Let's examine the process.
The name says it all
At the Idea Factory, we try to create a production line of ideas for traders; these ideas are assembled using a combination of technical and systematic approaches to the market. Sometimes, a bit of local knowledge is thrown into the mix.
I try to follow around 1000 stocks and ETFs across the US and Europe, which is far too many for any individual to manage efficiently on a daily basis.
So I don't even try.
Instead, I use a series of screeners, alerts and trackers to filter what's going on the market and my stock universes. And most importantly of all, to highlight what stands out from the crowd. An example of which can be found below.
A bubble chart of S&P 500 stocks and their position in the day's trading range, high and to the right, strong, low and to the left, weak.
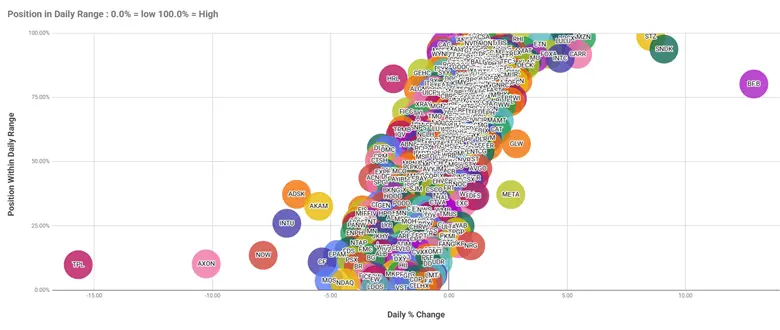
Source: Darren Sinden
That still leaves a lot of information to process.
For example, I have more than 60 pages of price alert emails in my inbox.
Thankfully, it’s become much easier to search large caches of information, and that's helpful.
I am undecided if AI is a benefit or a curse in its current state, but I will concede that when it comes to sorting through, filtering or summarising information, it can be very effective.
For example, I use a simple form of AI to filter my email alerts in this instance to look for mentions of TER US
A sample of which you can see below. I have more than 900 messages that mention Terradyne, dating back to 2024.
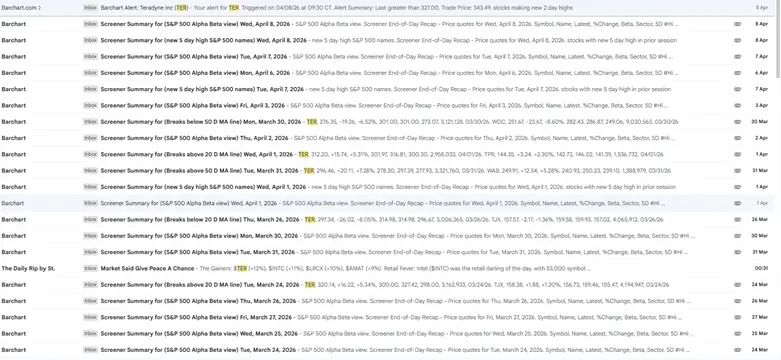
Source: Darren Sinden
That's what I mean when I talk about local knowledge. I may not know Teradyne well, but it's no stranger to me either.
You get to recognise patterns or changes in behaviour in a stock like this over time.
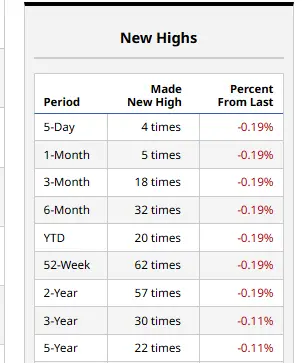
For example, look at the table below, which shows the frequency of new price highs in Teraadyne.
Note that it's posted 62 new highs in the last 52 weeks, but only 57 in the last 2 years. Momentum has been building.
Source:Barchart.com
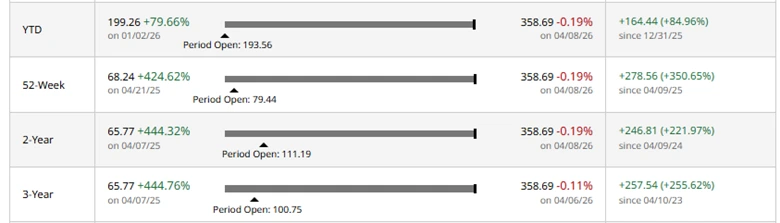
We see something similar here, in the performance of the Teradyne stock price over various time frames.
Most obviously, the 52-week performance far outweighs the 2 and 3-year returns in the stock.
And of course, YTD it's up by an impressive +85.00%.
Source:Barchart.com
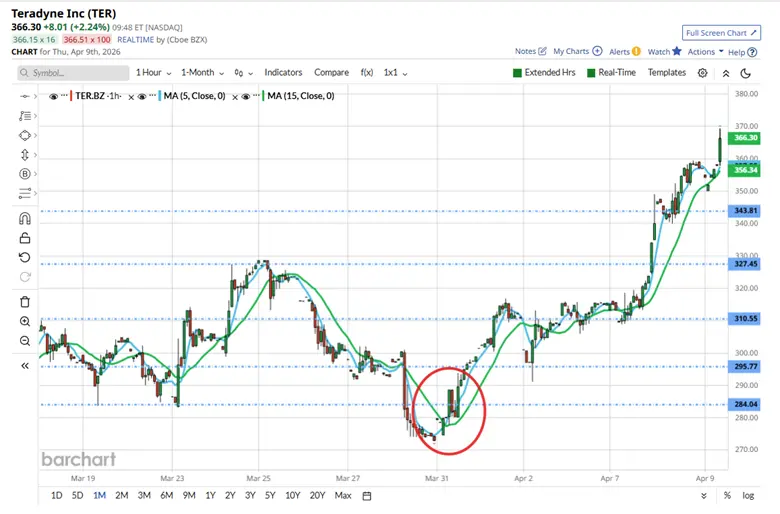
We can see this playing out in the up-to-date chart of Teradyne above
And what's also very noticeable is that the 50-day MA line (shown in green) acted as support for the stock, throughout its run higher.
In fact, it has not been below that line since early June 2025.
Broker Comments
There was a buzz among US brokers about Teradayne over the last 3 months, and the majority of comments and actions were positive.
Key Analyst Actions (Last 3 Months):
- Baird (March 30, 2026): Analyst Quinn Fredrickson raised the price target to $332 from $305, maintaining a "Buy" rating and highlighting improving cyclical trends.
- Morgan Stanley (Feb 11, 2026): Analyst Shane Brett raised the target to $306 from $288, maintaining a "Hold" rating while noting anticipated strong growth in the networking segment.
- Citigroup (Feb 4, 2026): Lifted the price objective to $325 from $215, giving the company a "Buy" rating.
- Cantor Fitzgerald (Feb 2, 2026): Raised the price objective to $270 from $240 and gave an "Overweight" rating.
- Zacks Research (Feb 5, 2026): Upgraded Teradyne to "Strong Buy," positioning it in the top 5% of covered stocks due to superior earnings estimate revisions.
- Northland Securities (Feb 5, 2026): Downgraded to "Hold" with a $270 target, citing valuation concerns despite strong growth.
Source Google/Gemini
Call to action
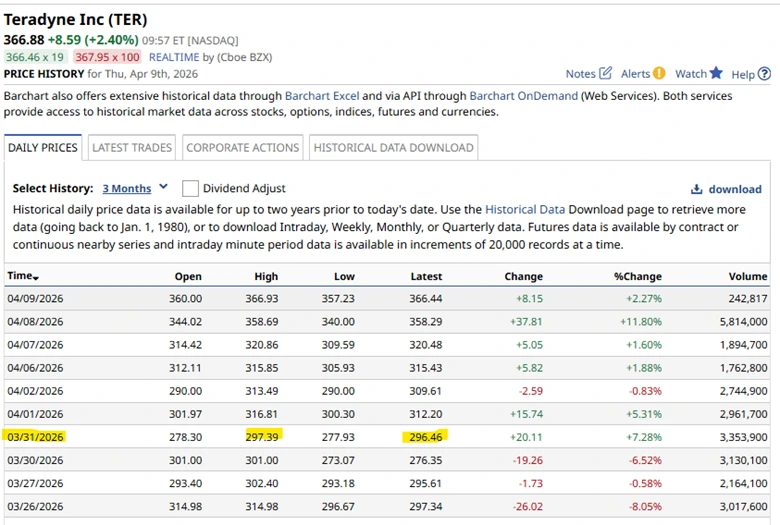
I highlighted Teradyne to the Idea Factory members when it crossed $284.00, an old support/resistance level. A subsequent break above the 50-period MA line acted as confirmation, as did the fact that the stock closed within a whisper of its daily high at 297.39.
See below
Source:Barchart.com
It hasn't closed below $300 since then
The breakout, as I saw it in Teradyne
Source:Barchart.com
In summary, we had a stock with existing upside momentum that occupied a niche position in the semiconductor supply chain, and it was receiving mostly positive broker comments. It had a demonstrable record of posting new highs. It broke above old support and resistance, closing close to the daily highs, a sign that the bulls were in charge of the market at that point.
From there, the stock didn't look back.
The information provided does not constitute investment research. The material has not been prepared in accordance with the legal requirements designed to promote the independence of investment research and as such is to be considered to be a marketing communication.
All information has been prepared by ActivTrades (“AT”). The information does not contain a record of AT’s prices, or an offer of or solicitation for a transaction in any financial instrument. No representation or warranty is given as to the accuracy or completeness of this information.
Any material provided does not have regard to the specific investment objective and financial situation of any person who may receive it. Past performance is not a reliable indicator of future performance. AT provides an execution-only service. Consequently, any person acting on the information provided does so at their own risk. Forecasts are not guarantees. Rates may change. Political risk is unpredictable. Central bank actions may vary. Platforms’ tools do not guarantee success.