As we head into Q3 earnings season in the US, it seems a good time to consider whether S&P 500 stocks look cheap or dear, and to consider how they are being valued by the market.
As with beauty, value is in the eye of the beholder and there are numerous ways that we can try and value stocks and the future potential.
However one the best and most practical ways to do this is to compare the S&P 500 components to each other.
Compare and Contrast
Let's start that process by discovering what the average S&P 500 stock would look like if it existed .
The stock would trade on a Forward PE Ratio of 26.91 times earnings, well ahead of both the 5 and 10 year averages for the index ,which come in at 19.50 and 18.0 respectively.
It would have a 5-year Revenue Growth rate of 64.80% and 5-year Earnings Growth rate of 147.33%.
It would yield 1.75% and would have grown its dividend by almost 91.0% over the last five years.
its Dividend Payout ratio (the percentage of earnings that the company returns to its shareholders) would be just under 44.0%, and it would have a profit margin of 13.49%.
The stock would trade on a Price to Book ratio of 8.51 times and a Price to Sales ratio of 4.62 times.
Tt would be covered by 19 analysts and it would be rated at 3.95 out of 5.00.
Though the average dividend yield for S&P 500 stocks is 1.75% yet there are plenty of stocks that offer a higher yield
And, in the chart below I have selected those stocks which yield 4.0% or more, of which there are 42, and I have plotted their Dividend Yield against their respective Forward PE ratios.
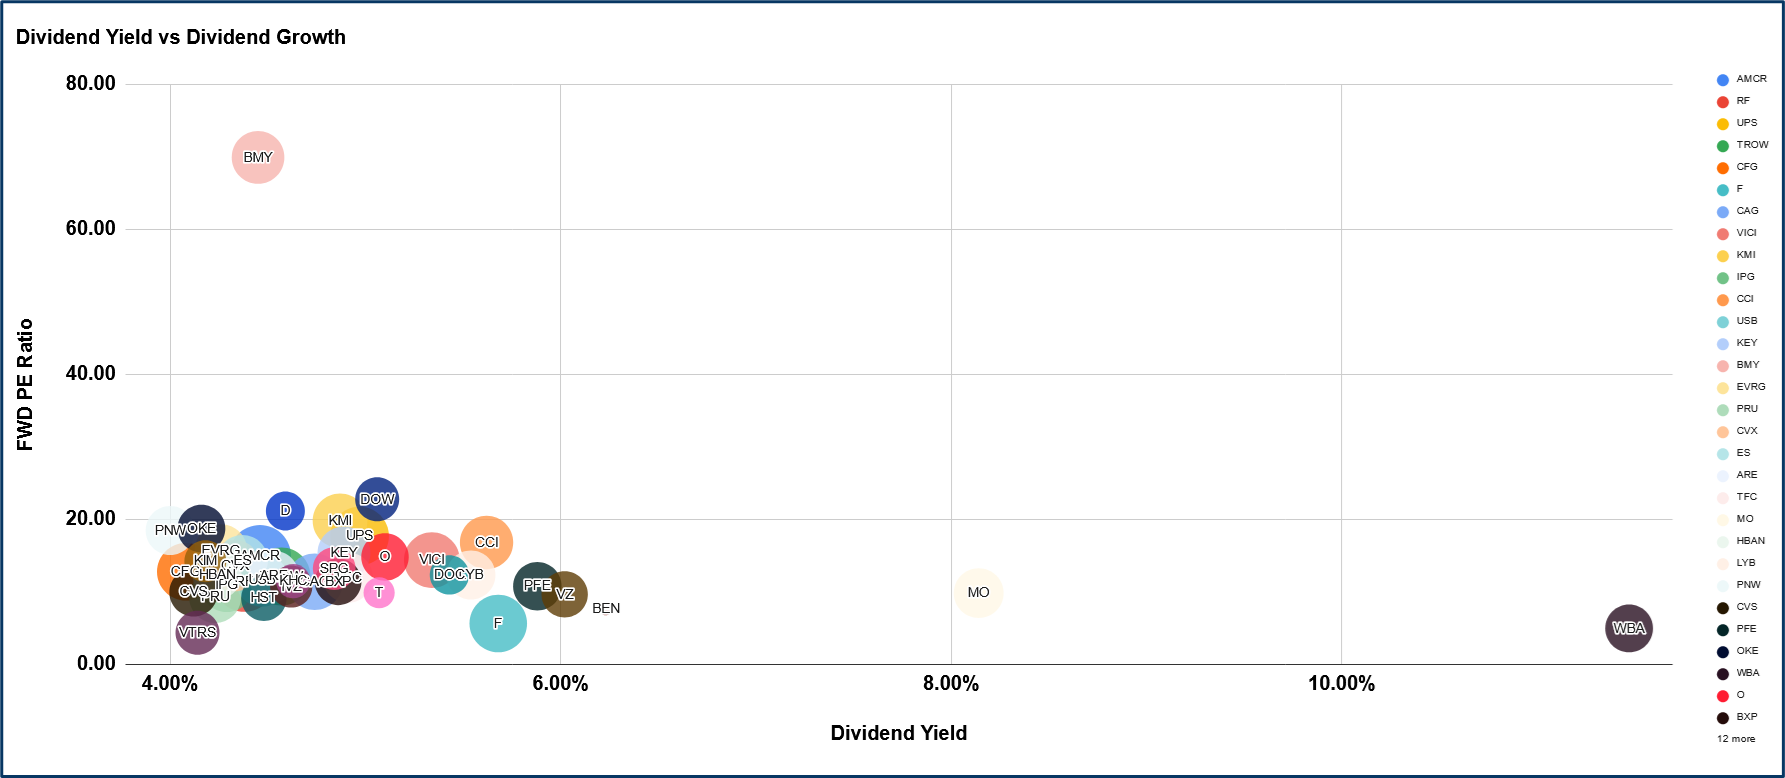
Source:Barchart.com/ Darren Sinden
Walgreens Boots Alliance WBA US has the highest dividend yield at 11.47% and it sits on a Forward PE of just 4.94 times, a fraction of the Average Forward PE for the S&P 500 constituents.
Surely this represents good value?
After all, an annual income of 11.00% should be valuable when interest rates are falling shouldn’t it?.
It would be, if it were thought to be sustainable
However the low PE, and the fact that WBA US stock has fallen by more than -65.0% over the year to date, tell us that the market doesn't believe that the dividend is sustainable. As the company lurches from one crisis to another.
This two year chart line ( see below) shows us what's been going on.
The red line is the 50-day moving average, and for most of the last two years, the stock has been below both it, and the downtrend line, drawn in pink.
Worms can turn, but we shouldn't try and pick a bottom in the stock because there could still be $9.15 of further downside.
Rather we would want to see the price action signal a trend change is on the cards.
That could coincide with a sustained move back above the 50-day MA line.
However, there would also need to be a significant fundamental catalyst as well, if the stock price was to reinvigorated
WBA US is cheap, but its “cheap for a reason”

Source:Barchart.com
The other end of the spectrum
Now let's look at a different group of stocks those with a Forward PE of 50 times or greater.
The PE ratio measures the multiple of a stocks annual earnings that investors are prepared to pay own the stock.
Remember that that the Average Forward PE of 26.91 among the index components was already well in excess of the long term index averages.
So what are we to make of a stock like Crowdstrike CRWD US, which is on a Forward PE of 550 times earnings?
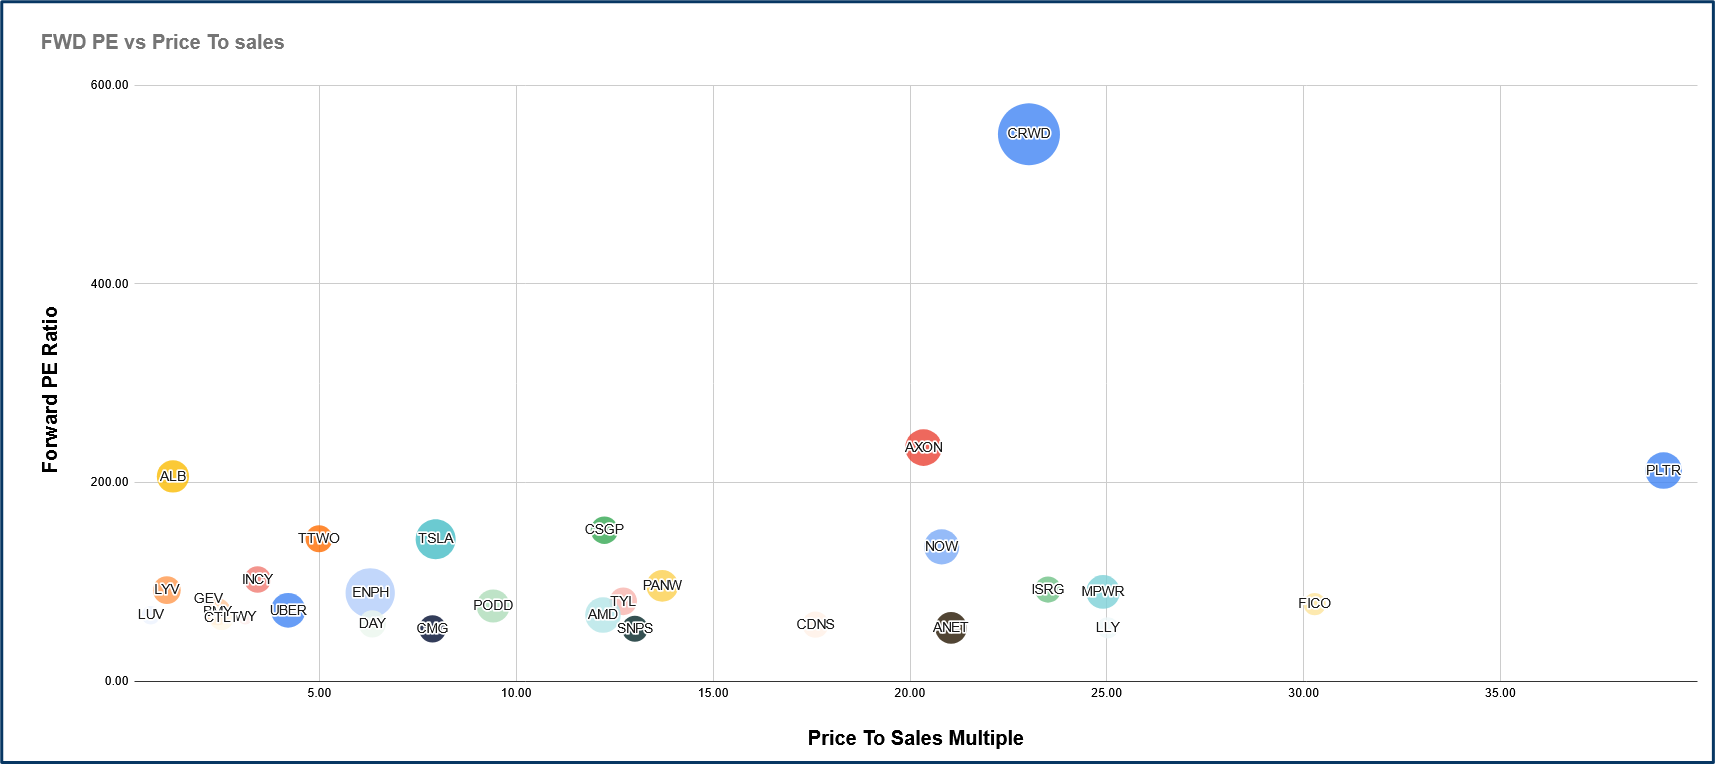
Source:Barchart.com/ Darren Sinden
Surely this is wildly over valued when compared to the rest of the market?
You have to say that on these metrics yes it is.
A Price to Sales ratio of 10.0 times is thought to be excessive by historical standards but CRWD is trading on a multiple of 23 times sales.
If we dig a bit deeper though we find that CRWD has grown its revenues by more than +1100% over the last 5 years.
And despite the fall out from its botched software updateback in August, which shut down a large chunk of the internet, Crowdstrike stock has appreciated by almost+ 62.0% over the last 52 weeks.
And whilst this doesn't justify the outrageous PE multiple, it does suggest that that the stock could grow into it quite quickly, and that is what buyers of Crowdstrike are betting on, whether they know it or not.
These are just two examples of how a comparison of fundamental data can highlight outliers within a stock universe.
WBA US and CRWD US may be at the extremes, but there are plenty of other stocks which are trading above or below the index averages.
Our job as traders is to identify those stocks and asses their future potential, whether it be good or bad.
And then work out what it would take to manifest that potential?
And what effect that woud have on the stock price.
The information provided does not constitute investment research. The material has not been prepared in accordance with the legal requirements designed to promote the independence of investment research and as such is to be considered to be a marketing communication.
All information has been prepared by ActivTrades (“AT”). The information does not contain a record of AT’s prices, or an offer of or solicitation for a transaction in any financial instrument. No representation or warranty is given as to the accuracy or completeness of this information.
Any material provided does not have regard to the specific investment objective and financial situation of any person who may receive it. Past performance is not a reliable indicator of future performance. AT provides an execution-only service. Consequently, any person acting on the information provided does so at their own risk.