Those words form the opening lyrics of a song that's had recurring chart success in the 60s, 70s, 80s, and 90s, which has been covered by numerous artists around the world.
It's fair to say that “ can't take my eyes off you” has become a “standard”.
I was reminded of that song this week, when I saw the news from AI server maker Super Microcomputer SMCI US, whose share price plunged by more than 28.0%, following the resignation of its auditors, EY, who felt unable to sign off on the company’s accounts.
Something that's never a good look for any business, let alone one whose accounting policies have been called into question by short sellers, and which have come to the attention of the US Department of Justice.
I have mentioned SMCI US a few times in my articles this year but I have become ever more cautious on the name since the alleged accounting issues came to light.
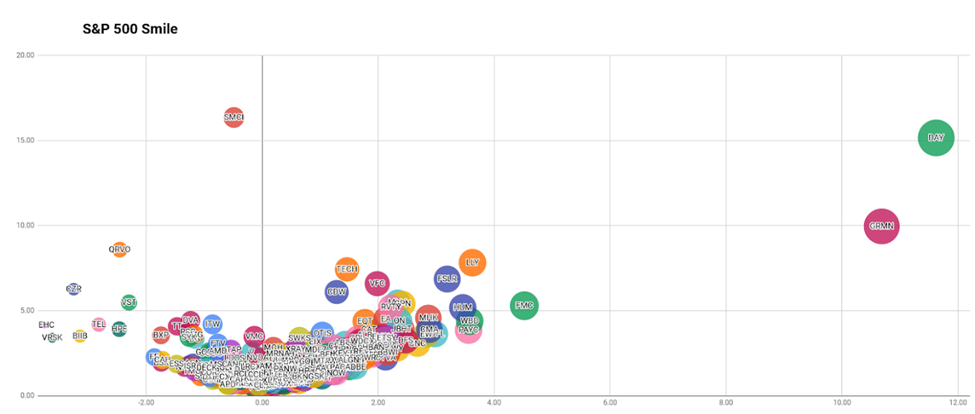
Indeed back on the 7th of October I shared this snapshot of my S&P 500 Smile chart with the members of one the trading discords I belong to saying that:
“SMCI (is) streets ahead of anything else and its price action relative strength is off the clock but (I) remain wary after recent events”
S&P500 Smile Chart from 07-10-2024

Source: Darren Sinden
The higher, and further over, a bubble is,to the right, on the chart, the stronger its price action looks when compared to the other members of the S&P 500 index.
If something looks too good to be true, and it’s way out of kilter with the rest of the market, then it probably is too good to be true, and will eventually come back down to earth with bang.
Stocks that are moving sharply higher, or rebounding strongly will often register a score of 6.0 or perhaps even 7.0 on the horizontal axis on the smile.
However, as we can see back on October 7th SMCI had reached 11 and was pushing on towards 12.0. And it was in a similar position on the vertical axis as well.
Once again that was an unusually high reading too.
If something looks too good to be true, and it’s way out of kilter with the rest of the market, then it probably is too good to be true, and will eventually come back down to earth with bang.
None of which is to say this kind of readings can't or shouldn't happen, just that it’s extremely unusual.
That said, we have a couple of stocks within the S&P 500, at the time of writing, that are making similar noises on this chart. Namely Garmin GRMN and Dayforce DAY, and it will be interesting to see if they can justify their extreme positioning on the right hand side of the chart from here.
S&P 500 Smile Chart from 30-10-2024
Source: Darren Sinden
Recurring patterns are a common feature of the market and they can provide traders with useful tools and benchmarks, against which they can gauge the state of the market, and the likelihood, or probability of trade moving in their favour.
The trouble is that very few of these patterns and recurring behaviours are 100% accurate, and as with all trends in the market, they are subject to change.
One of the rules of thumb that I like to follow is the idea that if a stock is trading above its 50 day MA line, in the run up to earnings that's a bullish signal and one that could be indicative of a positive earnings surprise. If it's trading below the 50 day MA then the opposite could also be true.
Of course, could is not the same as will, so how might a trader judge what position to have in a stock, based on this type of yardstick?
Well, one way would be to look for confirmation from other signals in the price action.
Take this recent chart of US Housebuilder D.R. Horton DHI US.
The stock had been trading above its 50 day MA line ahead of earnings on October 29.
However, it broke below that line on October 21st, and then posted a bearish MA crossover. the next day.
Note also that the subsequent candles in the chart were either outright bearish or indecisive at best.
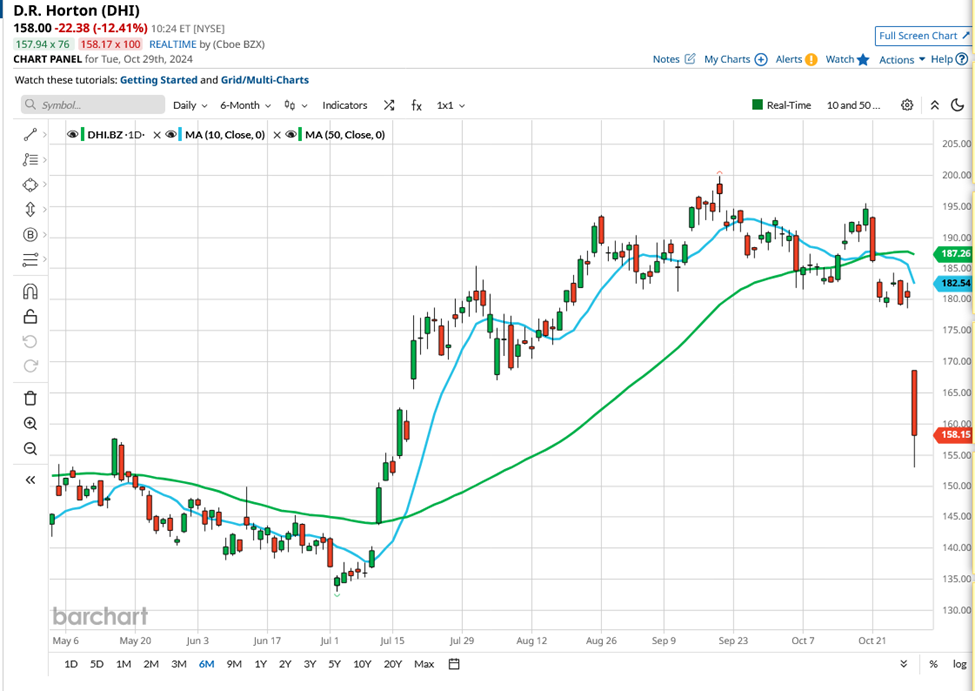
Source:Barchart.com
D.R Horton’s earnings came in well below the street’s expectations,and the builder guided lower on full year revenues as well. It sold off sharply trading down to as low as $153.00, some $27.00 below the prior close.
Now, it must be said that trading on earnings releases can be very binary and share price reactions don't always work out in the way you might expect them too.
Disappointing guidance can often outweigh earnings and revenue beats and we also need to consider how much is already priced in and what sentiment is like towards the stock.
For example here is the chart of Ford F US which was trading above its 50 day moving average ahead of its recent earnings, which came in ahead of forecast, however the stock sold off because the outlook for the full year 2024 wasn’t good enough in the eyes of the market.
This headline sums up the situation perfectly I think
“Ford investors 'may struggle to see silver linings' from Q3, says Morgan Stanley”
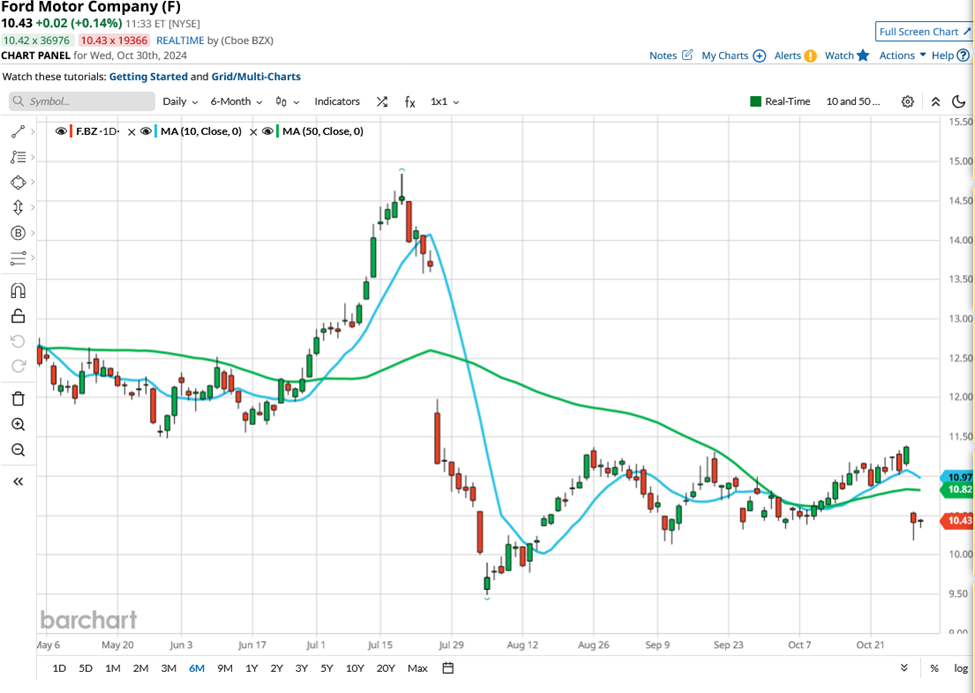
Source:Barchart.com
Were there any clues?
Would we have been able to anticipate that negative reaction to earnings from Ford, to the extent that it would have overridden the 50 day MA rule of thumb?
Could a longer term chart versus a sector peer have informed our thinking?
I believe it could have, because that chart says a lot about how markets view two stocks, that on the face of it seem like very similar businesses.
In this case I have plotted the percentage change in Ford versus that in General Motors GM, over the year to date.
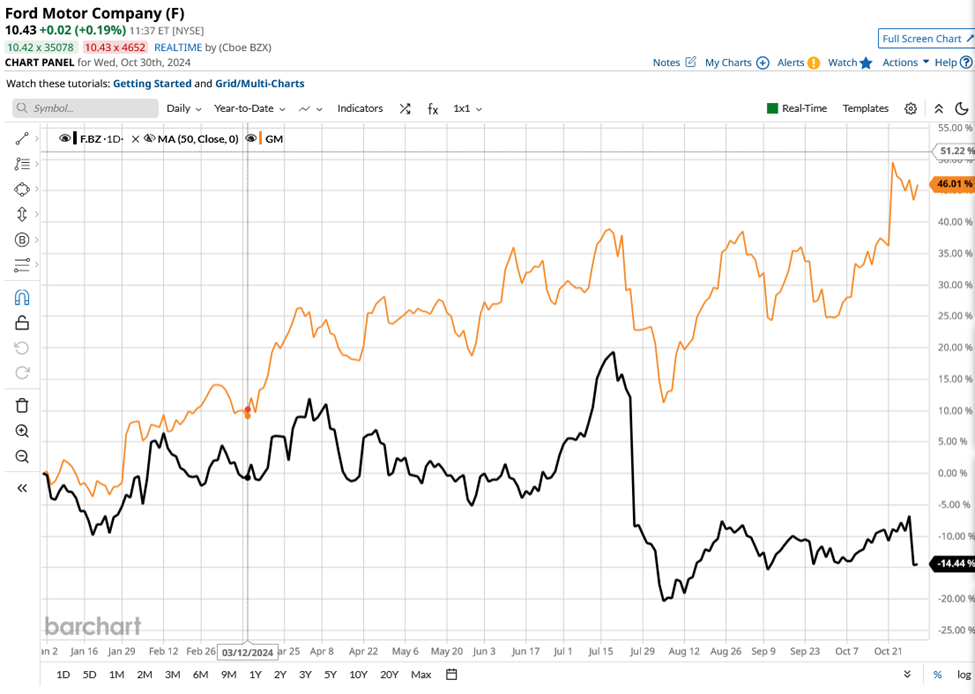
Source:Barchart.com
Looking at the chart and difference in performance between the two stock prices it's clear that the market has a downer on Ford and give the level of underperformance in the Ford stock price, it would have been pretty clear that unless its earnings and outlook were outright bullish then stock was unlikely to rally and so it turned out.
As traders we don't have a crystal ball or a time machine, to allow us to see into the future, however we do have access to a raft of fundamental and technical information about individual stocks and sectors, and their comparative performance.
And if we use that data in conjunction with some rule of thumb and our own intuition then we can likely make a very educated guess about what comes next in the price action.
The information provided does not constitute investment research. The material has not been prepared in accordance with the legal requirements designed to promote the independence of investment research and as such is to be considered to be a marketing communication.
All information has been prepared by ActivTrades (“AT”). The information does not contain a record of AT’s prices, or an offer of or solicitation for a transaction in any financial instrument. No representation or warranty is given as to the accuracy or completeness of this information.
Any material provided does not have regard to the specific investment objective and financial situation of any person who may receive it. Past performance is not a reliable indicator of future performance. AT provides an execution-only service. Consequently, any person acting on the information provided does so at their own risk.