
Volume is one of the most important, yet often overlooked, metrics within equity trading.
While price shows us where a stock is trading, volume shows how strongly a move in the price is supported.
In simple terms, volume tells you how many shares are being bought and sold, activity that can reveal whether a trend is likely to continue or fade away.
For traders, volume acts as a confirmation tool. A stock moving higher on strong volume usually suggests broad interest and conviction behind the move.
Whereas a price rise on weak volume can indicate a lack of commitment, from the market making that move vulnerable to a reversal.
The same principle applies on the downside: a sharp drop in price, accompanied by heavy volume, often signals strong selling pressure.
Here is a table of S&P 500 stocks.
I have filtered the table to show those stocks whose year-to-date average volume is greater than their 6-month average volume. And then I have ranked the table by year-to-date % price change.
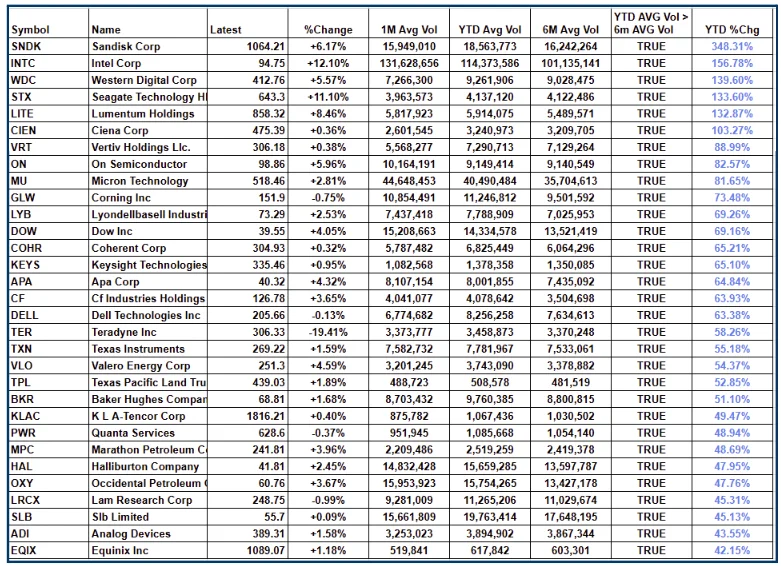
Source: Barchart.com/Darrensinden
I have only shown 31 stocks in this truncated view, but there were 158 S&P 500 stocks that met the volume criteria and that had a year to date percentage change greater than +10.00.
That confirms to me that rising volume is closely linked to price change (in this case, positive price change), which makes it something we should be paying attention to.
Here is a chart of Sandisk SNDK US with the Price Volume Trend or PVT indicator, in the lower window, as an example of what I am talking about.
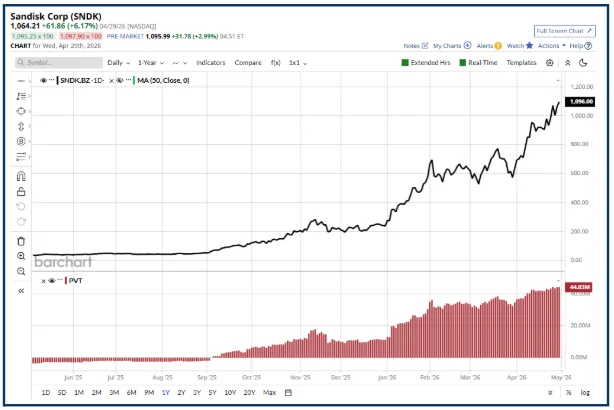
Source: Barchart.com
Staying Liquid
By definition, volume is closely linked to liquidity.
Stocks with higher volume are generally easier to trade because there are more buyers and sellers in the market.
This can mean tighter spreads and potentially better execution, which is especially important for active traders. Low-volume stocks, by contrast, can be harder to enter and exit without affecting the price.
This is where volume indicators become useful.
Indicators such as On-Balance Volume (OBV), VWAP, and Volume Profile help traders interpret raw volume data more effectively.
OBV tracks whether volume is flowing into or out of a stock, giving clues about accumulation or distribution.
VWAP helps traders understand the average price paid weighted by volume over a given time frame, and it is widely used as an intraday benchmark.
Volume Profile shows where the most trading has taken place at different price levels, helping to identify Key areas of support and resistance in a stock price.
Here is a screener that I use to highlight stocks trading above VWAP.
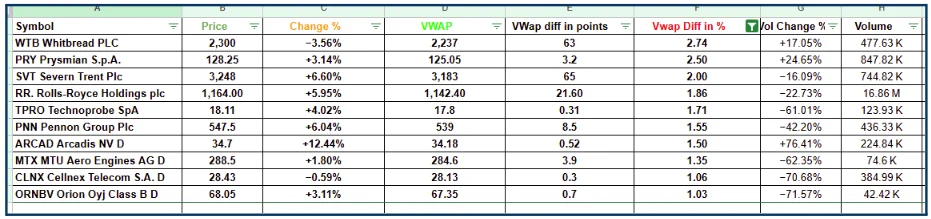
Source: Tradingview/Darren Sinden
The chart below shows UK-listed aerospace group Rolls-Royce RR LN, which is trading above VWAP (Volume Weighted Average Price) at the time of writing.
The current Rolls-Royce share Price is shown in green on the right-hand scaleD, whilst VWAP is the pink line and price box.
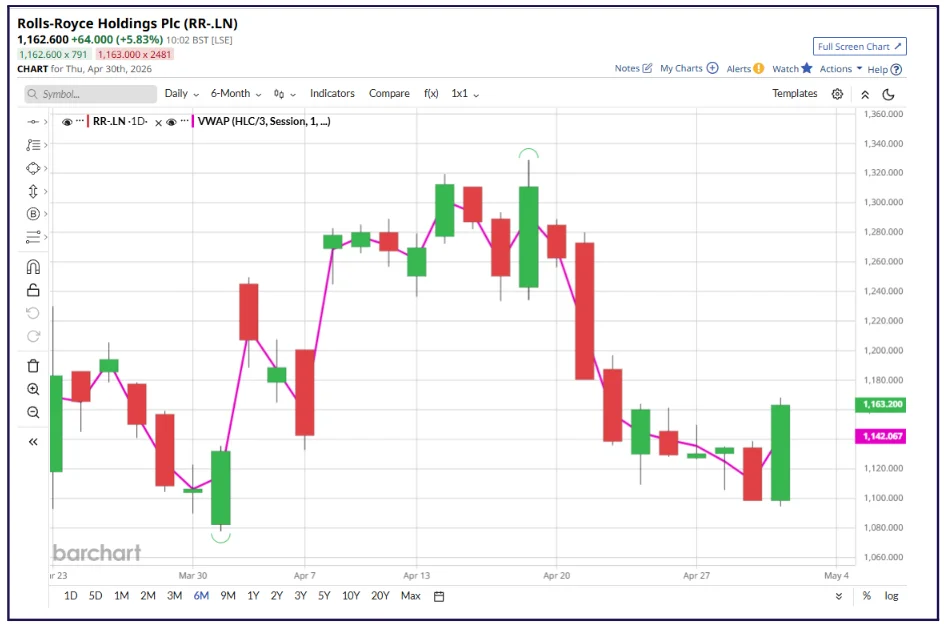
Source: Barchart.com
A stock that is trading well in excess of VWAP is often subject to excess demand, and where demand
outstrips supply, the price will rise.
Judging how much the price will rise and how quickly is a skill that traders develop over time.
One of the biggest advantages of volume-based indicators is that they can help filter false signals.
For example, a breakout above resistance may look exciting, but if it happens on weak volume, then the move may not be reliable. A breakout accompanied by strong volume, however, carries more weight and often attracts follow-through buying.
In equity trading, volume is not just a supporting metric; it is a key part of market behaviour and price action.
Traders who pay attention to volume and the indicators built around it are better equipped to judge trend strength, spot reversals, and improve timing. In short, price tells you what is happening, but volume helps explain how real the move is.
The information provided does not constitute investment research. The material has not been prepared in accordance with the legal requirements designed to promote the independence of investment research and as such is to be considered to be a marketing communication.
All information has been prepared by ActivTrades (“AT”). The information does not contain a record of AT’s prices, or an offer of or solicitation for a transaction in any financial instrument. No representation or warranty is given as to the accuracy or completeness of this information.
Any material provided does not have regard to the specific investment objective and financial situation of any person who may receive it. Past performance is not a reliable indicator of future performance. AT provides an execution-only service. Consequently, any person acting on the information provided does so at their own risk. Forecasts are not guarantees. Rates may change. Political risk is unpredictable. Central bank actions may vary. Platforms’ tools do not guarantee success.