We are now in the second quarter of 2024 (where did that first three months go?)
The situation on the ground, in equity markets, looks quite different to the one we might have anticipated at the turn of the year.
We haven’t seen any rate cuts from the FED, the ECB or the Bank of England.
Indeed the Bank of Japan raised rates and moved away from its policy of super easy money.
Looking at the performance of the major indices year to date, US markets have been eclipsed by both Japanese and European benchmarks, though a +9.90% gain for the S&P 500 is not to be sniffed at.
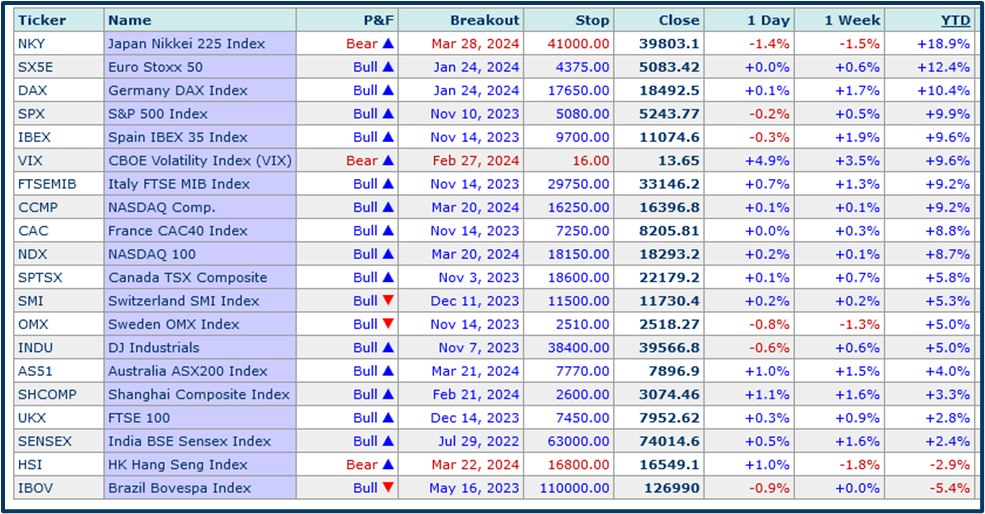
Source: Investors Intelligence
First quarter earnings on Tap
First-quarter earnings in the US are less than two weeks away so it seems like an appropriate time to take a look at what can be expected from those numbers, trader and market sentiment and capital flows.
We can’t really find much fault when we look at sector performance within the S&P 500 year to date.
The sliders on the right-hand side of the table below accurately describe the price action and the current positioning within the year-to-date range.
The majority of sectors and the S&P 500 index itself are towards the top end of their range and in a couple of instances very close to their outright highs.
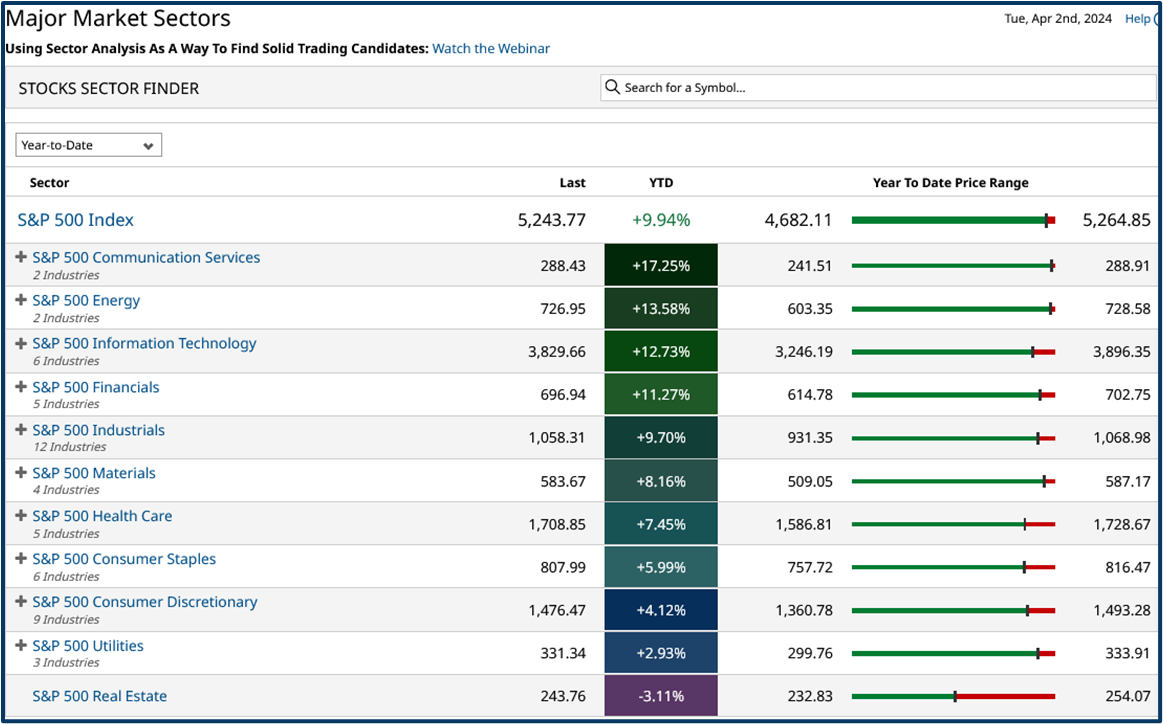
Source: Barchart.com
Real Estate stands out for being mid-range, though given that this is probably the most interest rate-sensitive sector, that’s not too surprising.
In fact, you could argue that given the push-back against rate cuts, Real Estate has punched above its weight, in 2024 to date.
Energy, is back in favour with some
Among the top performers year to date, we find the Energy sector up by more than +13.50%, so far in 2024.
Energy stocks were still unloved at the start of 2024 and over six months, the sector has managed gains of just +4.72%.
However, with tensions in the Middle East ratcheting up once more,oil prices are moving up again, and Brent and WTI are now better by around +9.0% over the last month.
Interestingly analysts have been cutting their earnings forecasts for the Energy sector in recent weeks.
And, according to research house FactSet, earning estimates for the sector have fallen by -12.30% during 2024
If oil prices continue to climb in the near term, that could create an opportunity, with the likes of Chevron CVX US and Exxon Mobil XOM US, reporting on 26/04/2024.
Interestingly, Chevron has seen the biggest cut to earnings forecast within the S&P 500 stocks, with analysts now expecting just $2.98 in earnings per share from the company down from their prior target of $3.58.
Is the market paying more for less in 2024?
Energy stocks are not alone in seeing downward revisions to earnings estimates from Wall Street analysts.
As this chart from FactSet shows.
Over the last quarter, earnings estimates, for the S&P 500 (dark blue), have been declining even as the index (turquoise) continued to move higher.
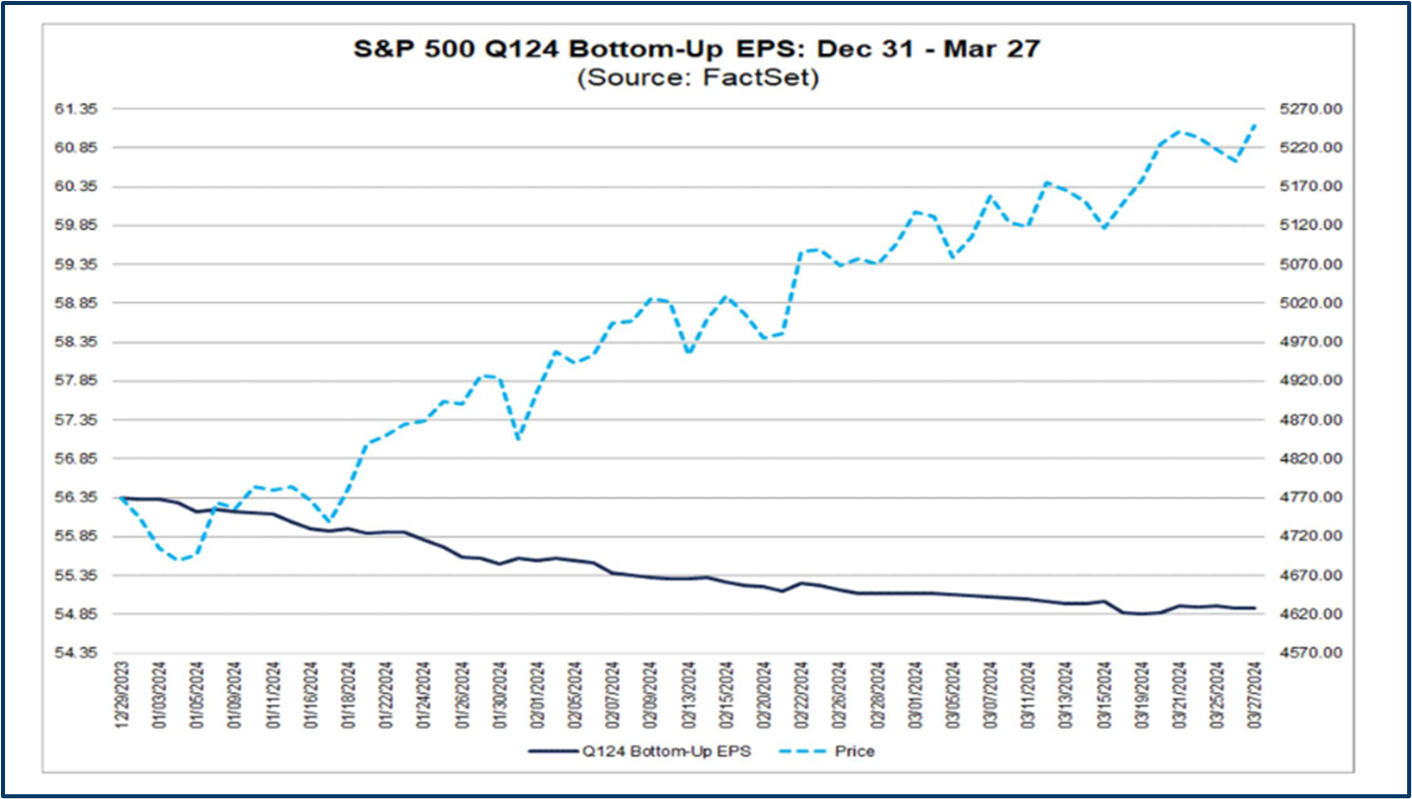
Source: FactSet Research
A clear example of multiple expansion, as traders and investors seem happy to “pay more” to “own less”.
Of course that assumes the analysts are right in their forecasts.
Historically Wall Street has tended to “lowball” its estimates” to give stocks the best chance of beating them, and in those circumstances, they don't mind being wrong.
Is a change in leadership on the horizon?
Information Technology has been the main driver of US equity gains over the last 18 months or more.
And coming into Q1 earnings season. Analysts are anticipating a +20.50% increase in earnings from the sector when compared to Q1 2023, which is up from an estimate of +18.50% at the beginning of the year.
However, there are some signs that the sector is slowing down, or at least that expectations are running ahead of what’s deliverable.
To try and visualise the impact that the Information Technology sector, and the Magnificent Seven stocks in particular, are having on the S&P 500 index, I have drawn this chart which plots the market cap weighted S&P 500 minus the equal weight version of the index.
The differential between the market cap weighted and the equal weight versions of the index
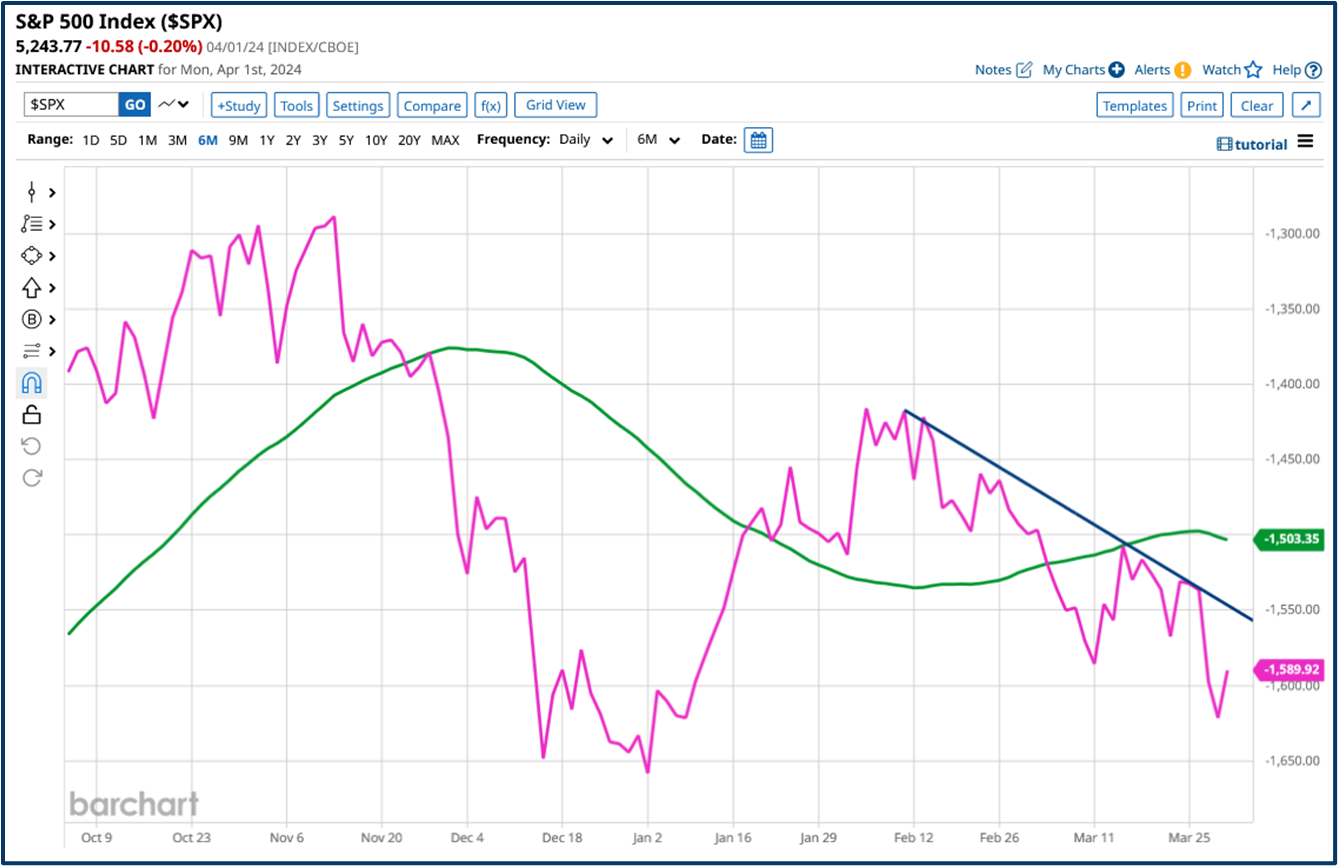
Source: Barchart.com
In the market cap-weighted version of the index, the biggest stocks have the most impact on the index value, simply because of their size. Whereas, in the equal weight version, it is price change rather than size that matters.
The differential between the two versions of the index (the pink line) effectively shows us the impact that the largest stocks are having on the index.
We can see how those stocks led the market higher from early January.
However, since the middle of February that impact has been trending lower.
And in late Feb the differential fell below the 50 Day moving average, drawn in green.
Two of the Magnificent Seven stocks are already in the red year to date.
Tesla TSLA US has fallen by almost -30.0%, whilst Apple AAPL US, which until recently was the world’s largest company, has lost -11.69% year to date.
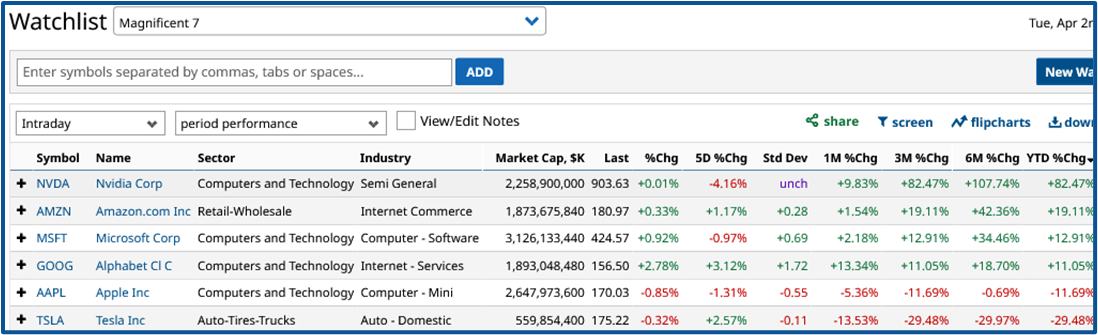
Source: Barchart.com
That begs the question if the Mega Caps/Magnificent Seven are starting to slow down, can the other 490-odd stocks in the S&P 500 index pick up the slack?
Discovering the answer to that question is one of the reasons why Q1 2024 earnings season promises to be so interesting.
The information provided does not constitute investment research. The material has not been prepared in accordance with the legal requirements designed to promote the independence of investment research and as such is to be considered to be a marketing communication.
All information has been prepared by ActivTrades (“AT”). The information does not contain a record of AT’s prices, or an offer of or solicitation for a transaction in any financial instrument. No representation or warranty is given as to the accuracy or completeness of this information.
Any material provided does not have regard to the specific investment objective and financial situation of any person who may receive it. Past performance is not a reliable indicator of future performance. AT provides an execution-only service. Consequently, any person acting on the information provided does so at their own risk.