So said former US President John F Kennedy little knowing that his own clock was counting down.
I was reminded today what a precious commodity time is, it's the one thing that we never seem to have enough and often don't use, as wisely as we should.
Why do I say that?
Well because even though I analyse and write about the markets for a living there still doesn't seem to be enough time in the day to get everything done that I want to do.
Perhaps my time management could be better
Maybe I could take shorter and fewer breaks throughout the day, or get better at prioritising my tasks, or find a way to use AI to improve my productivity.
The reason I'm thinking about time and timing in this article is because it's becoming increasingly apparent that there are an enormous amount of trading opportunities that pass by unnoticed.
That’s what economists call opportunity cost.
Although if you never recognise the opportunity do you even realise that you have incurred a cost or foregone a possible trading profit?
Let’s look at real world examples
We will start with a stock that I have tracked quite closely and paid attention to and that is casino operator Wynn Resorts WYNN US, and this chart posted by myself in a trading discord on August 27th with the strapline “Are they worth a gamble?”
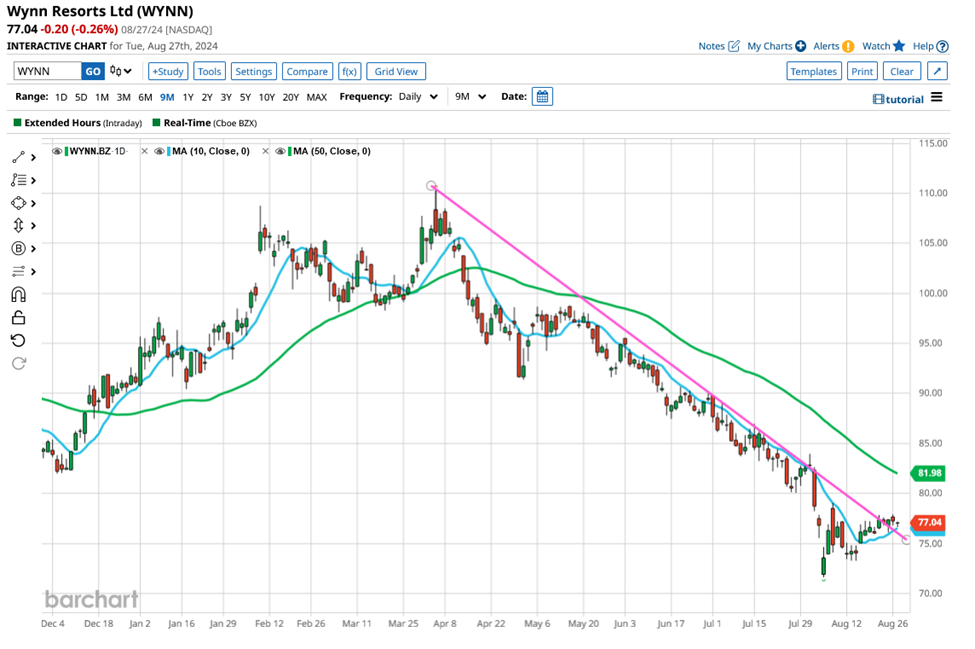
Source:Barchart.com
Can you see what caught my eye?
The pronounced downtrend from the March high, the stock price bottoming out in late August then moving/gapping back above the 10 day MA line and then testing above the downtrend line.
Just over a month later and the stock is trading above $100.00 a share so the answer to my question was clearly yes.
Another view
Now let’s have a look at another chart of WYNN US this one from October 1st.
This second chart is a simple line chart, showing the price line and the 10 and 50 period moving averages.
It also contains a clear call to action which I have highlighted with a magenta ellipse.
That ellipse encloses the point at which the faster moving 10 day MA line crosses up through the slower moving 50 day MA line which I interpret as a signal of rising price momentum.
Momentum that is also evident in the chart from the week before when the price line moved above the moving averages in relatively quick succession.
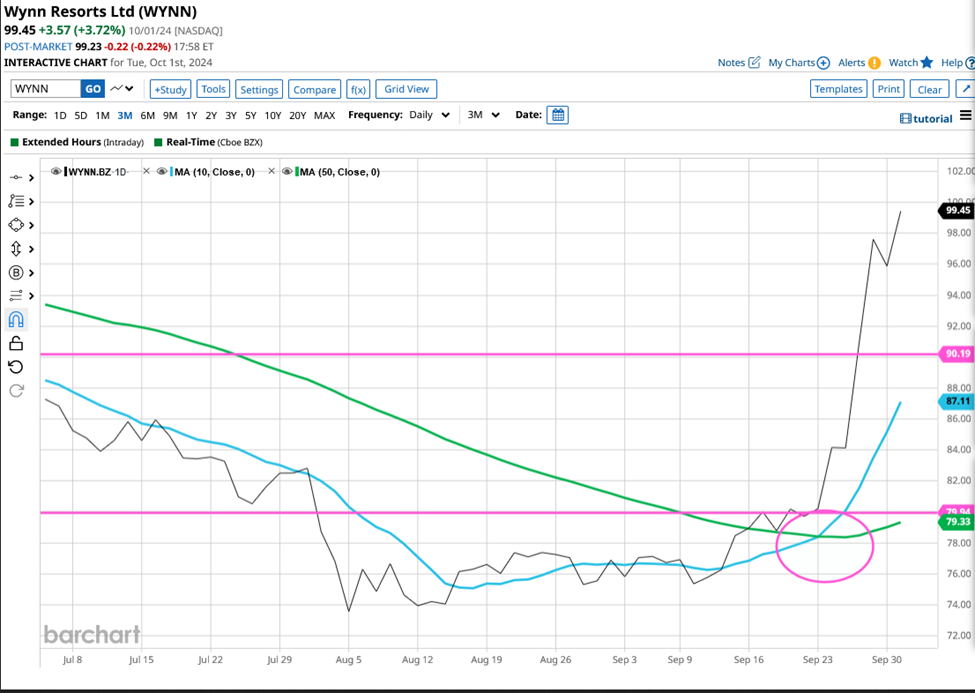
Source:Barchart.com
The MA cross acted as confirmation of the emerging uptrend in Wynn’s stock price, as well as a signal that we could expect an acceleration in that move and it played out very nicely.
The story started 10 months ago
There was more than $20.00 upside in the price, post the MA cross and indeed it looks like it's ongoing.However the opportunity, or least identifying the opportunity didn't just happen overnight.
For example take this alert which triggered on October 2nd but which I initiated way back in January.
By the way, if you are wondering what the reference to Swing Out Sister is all about they were a UK band in the 80s/90s whose biggest hit was called “Breakout”.
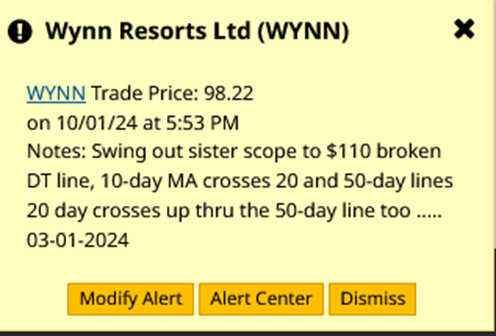
Source:Barchart.com
Keeping in touch
Not only did I start looking at Wynn’s upside potential back in January I also monitored it throughout the year. Or rather I used a series of screens and alerts to keep me updates about its potential.
In fact I have received more than 100 emails/alerts that were related to Wynn’s stock price performance, since the end of January, you can see a selection of those below.
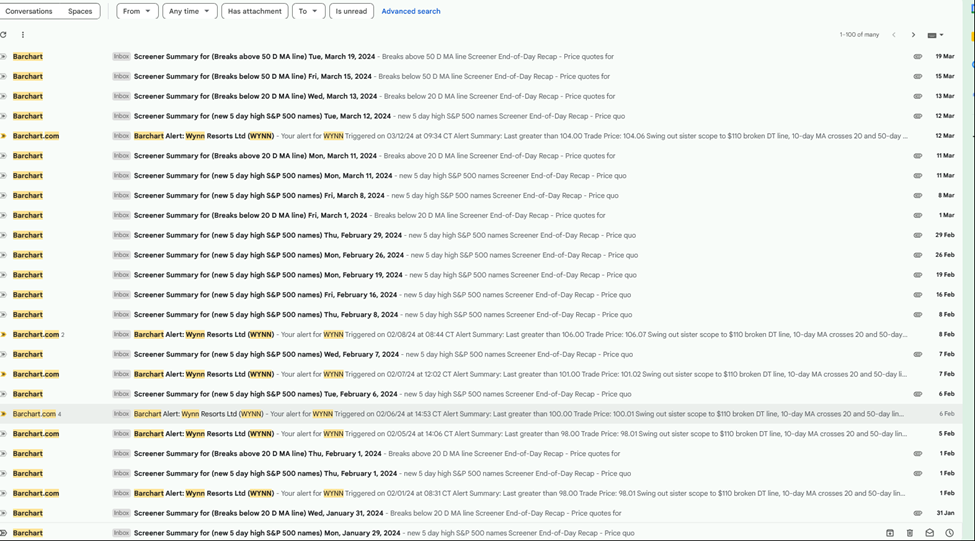
Source:Barchart.com
Making your own luck
So identifying opportunities like this can take time, and the process doesn’t happen in a vacuum.
The highly successful South African golfer, Gary Player, said that people thought he was lucky. To which he countered the more I practise the luckier I get.
And there is an element of that in finding trading opportunities, in as much as getting to know a stock and how its price action behaves takes time, and so does learning to recognise when an opportunity is being presented to you.
For example, what about this chart of US healthcare insurer, Humana Inc HUM US.
The stock has been struggling for much of 2024 but has sold off rapidly over the last couple of days.
In fact it’s lost -28.0% of its value in the last week and almost- 38.0% over the the last month.
Look what happened to the stock price when we saw an MA crossover back in December 2023 at around $500.00. We moved into a sustained downtrend and didn't find much in the way of support until the price hit $300.00 per share.
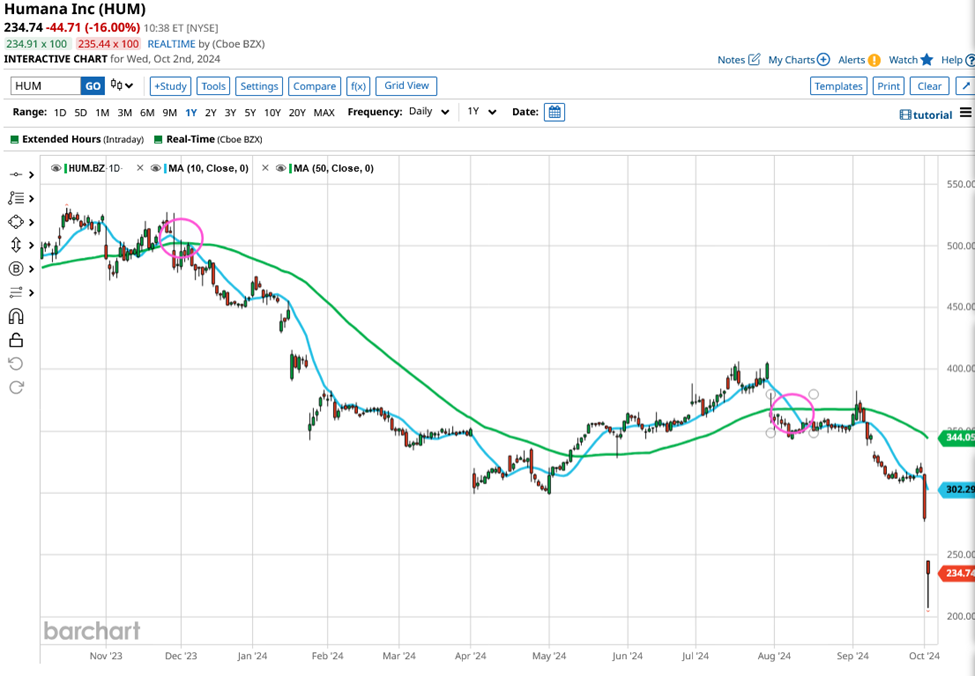
Source:Barchart.com
We saw the same signal from Humana in August, and though the stock didn't break down immediately on that occasion, when it started to move lower it did so with a vengeance.
They say that history doesn't repeat itself but it does rhyme and that is what's happened here
The take away from all this is to use your time wisely, get to know the stocks you are interested in.
Their habits, how the price action behaves,and the catalysts that drive price changes in them.
Identify key levels and points of interest in those stocks and set alerts for them.
Check their charts, and the news flow around them regularly, and then, like Gary Player you might find that you start getting” luckier” too.
The information provided does not constitute investment research. The material has not been prepared in accordance with the legal requirements designed to promote the independence of investment research and as such is to be considered to be a marketing communication.
All information has been prepared by ActivTrades (“AT”). The information does not contain a record of AT’s prices, or an offer of or solicitation for a transaction in any financial instrument. No representation or warranty is given as to the accuracy or completeness of this information.
Any material provided does not have regard to the specific investment objective and financial situation of any person who may receive it. Past performance is not a reliable indicator of future performance. AT provides an execution-only service. Consequently, any person acting on the information provided does so at their own risk.