I was asked to write an article for a personal finance website this week, the subject of which was what is the safest investment right now?
The more I thought about this seemingly innocuous question, the harder it became to formulate a simple answer.
Answering the question is made additionally difficult by where we find ourselves in the markets right now.
US equity indices, which are the drivers of global stock markets, are trading around their all time highs. However, at the same time gold has also moved to new record highs, as has silver.
The idea that risk assets and safe havens should rally to new highs together, is hard enough to get your head around.
Indeed as the chart below shows it's only really happened twice in the last 25 years.
The percentage change in spot gold vs the S&P 500 over 25 years
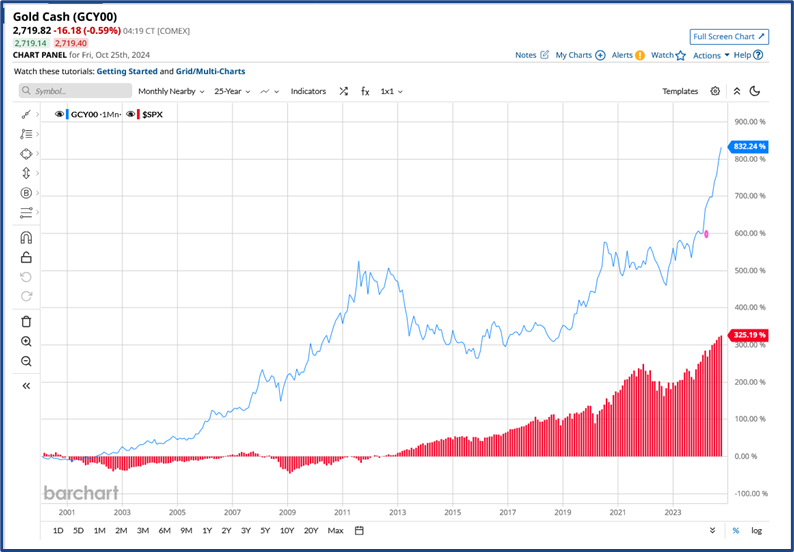
Source: Barchart.com
However, we then have to factor in what's been happening to yields, in so-called risk-free-assets or government bonds. The prime example of which are US Treasury bonds and notes.
Which, at maturities of a year or greater, have been rising, even as US interest rates are on a downward trajectory.
US 10-year Treasury Bond yield
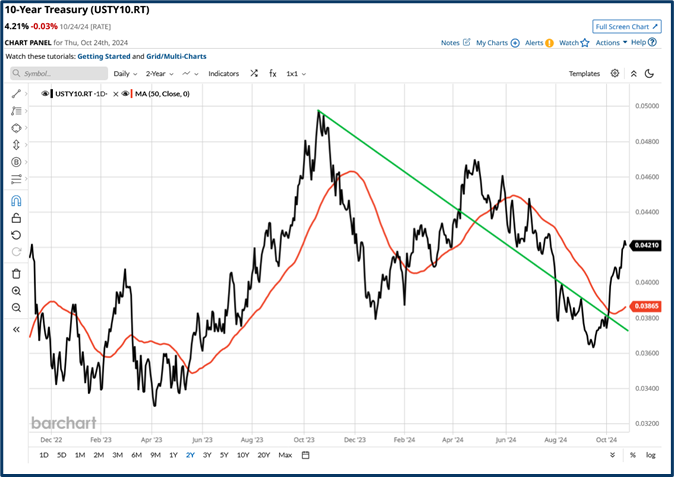
Source: Barchart.com
How the Bond market is thinking
We got an insight into the bond markets thinking this week when the UK Chancellor, Rachel Reeves, suggested that she would move the fiscal goal posts, to allow more government borrowing and in turn more government spending.
As the Chancellor's comments hit the news wires, yields on UK Gilts, which act as proxy or shorthand, for UK government borrowing costs, started to rise.
That's the bond market's way of saying, ok you can make those adjustments to your borrowing and spending plans, but it will cost you more.
Ideas of safety might not seem that relevant to traders whose positions are often short term in nature and who can often be in cash in between trades, but even here there is a read across, we can use capital preservation as proxy for safety.
Traders need to protect and preserve their capital, if they are to have longevity in the markets, and thus be exposed to the greatest number of trading opportunities.
To achieve that, they need to be disciplined about money and risk management, trade sizing ,stop losses and cutting losing positions.
However, they also need to consider how correlated or interlinked their positions are.
The links between positions might not seem obvious, but all FX pairs and crosses, are by their very nature, correlated to the performance of the dollar. As are the overseas earners within the FTSE 100 index, and the prices of most commodities.
A trader could quite legitimately have positions open in say EURUSD, gold, and the FTSE 100 index and feel that their exposure was diversified.
When in fact there’s actually a common denominator running through the portfolio, that can affect the prices and performance of all three positions.
Using and identifying proxies
On one of the trading Discords I contribute to, a member asked about how they could position themselves in commodities, following recent comments from strategists at Goldman Sachs, that they expected returns from the S&P 500 to average out at +3.0% per annum over the next decade.
The last ten years have seen the US equity index generate a cumulative return of almost 188.0%, quite a contrast to what Goldman is now forecasting.
Of course markets are cyclical and nothing moves in a straight line forever.
The cyclicality of markets was one of the reasons why the “wise heads” on the discord didn't think that commodities themselves were necessarily the best way to play this theme.
The thinking being that commodities tend to do well ahead of turn in the economic cycle. The point at which the global economy starts to expand, after a period of contraction or flatlining.
The consensus was that this isn't really where we are right now.
The question got me thinking and I wanted to look at how basket of commodities had performed over the medium term.
So I chose the Goldman Sachs Commodity Index or GSCI as it's known as my benchmark.
And I thought it would be a good idea to compare its performance versus a sector that's closely related and directly exposed to commodity prices.
So I choose the S&P 500 Basic Materials sector and drew the 5-year percentage performance chart below.
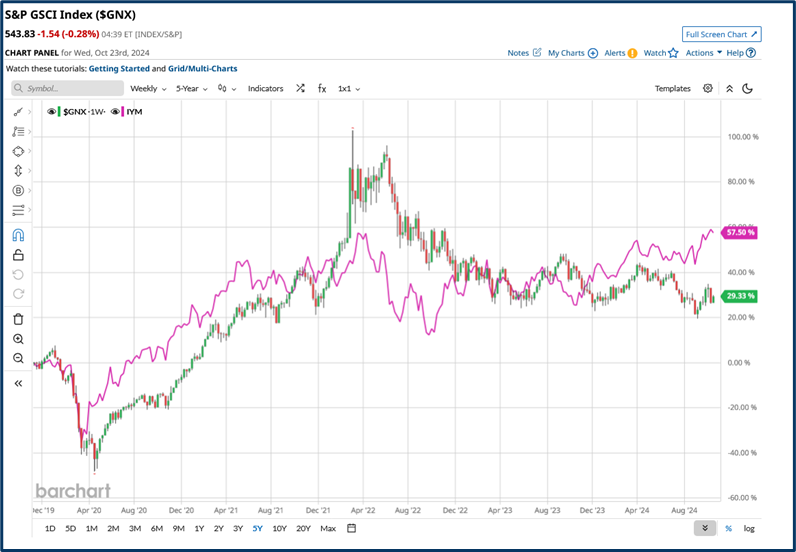
Source: Barchart.com
We can see that the performance of GSCI peaked in the spring of 2022( having rallied for two years previously) as much of the world moved out of lockdown, and got used to living with Covid-19.
The materials sector (the pink line on the chart above) initially outperformed the commodity index post lockdown, and by the same token it underperformed the index during the April 2022 sell off.
However the sector then rallied in August 2022, and over the last two years it’s risen by +31.80%.
Whereas the Goldman Sachs Commodity Index didn't rally, and has fallen by more than -14.40% in that time.
Two relatively simple questions have given me considerable pause for thought this week.
My conclusions about “safe investments” were that time in the market and diversification, were likely to be your best friend and the best way to safeguard your investments.
Whilst the question on commodities vs equities raised issues about trade timing and cyclicality, and the potential for outperformance from proxies or closely related asset classes.
There are many themes and narratives running concurrently in the markets at any point in time.
Retail traders may not always be able to directly participate in them.
However, with a bit of lateral, or, out of the box thinking, they can probably find an instrument that can provide them with some exposure, even if it's one or two steps away from the underlying theme itself.
The information provided does not constitute investment research. The material has not been prepared in accordance with the legal requirements designed to promote the independence of investment research and as such is to be considered to be a marketing communication.
All information has been prepared by ActivTrades (“AT”). The information does not contain a record of AT’s prices, or an offer of or solicitation for a transaction in any financial instrument. No representation or warranty is given as to the accuracy or completeness of this information.
Any material provided does not have regard to the specific investment objective and financial situation of any person who may receive it. Past performance is not a reliable indicator of future performance. AT provides an execution-only service. Consequently, any person acting on the information provided does so at their own risk.