Back in August I wrote two articles on the subject of where to look now.
https://www.activtrades.com/en/news/where-to-look-now
And
https://www.activtrades.com/en/news/where-to-look-now-part-ii
If you cast your mind back you may recall that the markets experienced a moment of panic in early August as the so-called carry trade began to unwind.
A carry trade is one that takes advantage of interest rate differentials to borrow cheaply in one market, typically one with low interest rates. And then investing those funds into another market, which is offering far higher returns.
The Japanese yen is the funding currency of choice for such trades and you can see why when we look at this table which shows the interest rates for a selection of the world's economies and currencies.
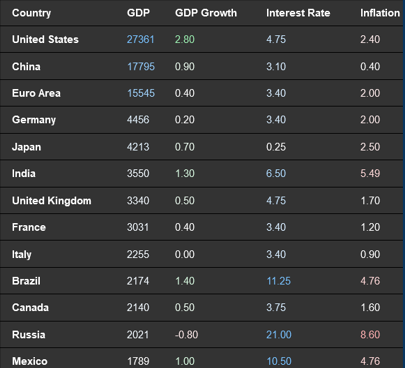
Source: Trading Economics
Panic Stations
During the panic the yen strengthened and equities sold off sharply.
The panic appeared from nowhere, spread quickly and then it was gone........ but of course not everything returned to equilibrium overnight.
And, as I noted at the time, the market has a tendency to “throw the baby out with the bath water” or overreact, using a broad brush to make decisions and going into “sell everything” mode, rather than acting in a more discerning fashion.
This is the perfect example of our “fight or flight” instincts at work, a set of subconscious behaviours that takeover our thinking at times of extreme stress, drowning out any rational thought processes.
Fear is a far stronger emotion than greed, and that's one of the reasons that market meltdowns are often larger and more volatile, than so-called meltups.
However once the storm has passed, we can literally take stock and look to see what's been unfairly punished. and that's exactly what I described in the first part of “ Where to look now”
Sifting through
At that time I screened the S&P 500, looking for stocks that met a set of specific criteria.
You can read more about those, in the original article, see the links above.
Starting with more than 380 names, I filtered and sorted the list until we had less than 30 stocks.
At the time, I created a watchlist containing those stocks, which would allow me to track their ongoing performance.
We can see that watchlist below.
The stocks have been ranked by their 50 day percentage change, a good proxy for the performance since the early part of August.
By no means are they all winners, but there are plenty that are.
Where to look now list

Source: Barchart.com
Could I have done better?
I flagged this performance in one of the trading Discords that I contribute to, alongside the original article.
And a little later I got a DM asking me some questions about them.
The questions were along the lines of “could we have identified and disregarded those stocks that went on to underperform, or even lose money, over the period since the creation of the list?”
I will admit I was slightly indignant when I first read the DM.
However, after a moment's pause, I re-read the questions and thought about what they were asking and how we could have achieved that outcome.
Having given it some consideration I replied that we could perhaps have filtered the list using qualitative screens looking at data and indicators about the quality of earnings among the constituents etc, and perhaps analyst ratings and so on.
However I tempered that by saying that only 7 stocks in the list were down over a 50 day period, whilst 21 were up, and that a 3:1 success rate seemed more than acceptable to me.
A better Mousetrap?
There is always the temptation to try and “build a better mousetrap” that is to try and make continuous improvements to a process. However, in doing that you run the risk of losing sight of your original objectives.
Remember the acronym K.I.S.S - Keep it Simple Stupid
As I said in my reply “ Striving to get everyone right would be the holy grail but like the fabled cup I don't think that's obtainable”
To which I added:
“The more variables you screen with, I think the more chance you have of losing the edge/creating a diminishing return (from your screen)”
Not every trade idea or opportunity will pan out and you shouldn't expect them to.
Losing is part of the trading process.
What successful traders do is achieve more winners than losers, by giving their trades the best chance of success, they achieve that by slanting the odds of success in their favour.
At the same time thjaye try to ensure that their winnings exceed their losses, by the biggest margin possible, that of course, is what risk reward ratios are all about.
The screen on the S&P, that I ran back in August was easy to implement. It was based on, and took advantage of well documented human behaviours and current market conditions, in order to highlight stocks, that had been adversely (or incorrectly?) marked down.
The subsequent upside was provided by a combination of mean reversion, and improving sentiment among, investors and traders, which in effect is the flipside to the panic, that started the ball rolling in the first place.
The information provided does not constitute investment research. The material has not been prepared in accordance with the legal requirements designed to promote the independence of investment research and as such is to be considered to be a marketing communication.
All information has been prepared by ActivTrades (“AT”). The information does not contain a record of AT’s prices, or an offer of or solicitation for a transaction in any financial instrument. No representation or warranty is given as to the accuracy or completeness of this information.
Any material provided does not have regard to the specific investment objective and financial situation of any person who may receive it. Past performance is not a reliable indicator of future performance. AT provides an execution-only service. Consequently, any person acting on the information provided does so at their own risk.