Fundamental inputs such as earnings, revenues, and economic data are vital components in the formation of market prices, and stock valuations. However,investor sentiment also plays a key role in shaping market movements and price changes, over the short to medium term.
Investor sentiment refers to the collective attitudes, feelings, and expectations investors have about the market's future direction and prospects.
This psychological component is a key driver of the buying and selling behaviour in financial markets, which are themselves, complex systems that are governed, not just by rational calculations, but also by human emotions and biases, such as fear and greed.
These emotions, and the sentiments they create, are particularly evident when markets swing from Risk-On to Risk-Off, and back again.
Or, when markets are trending and chasing a particular theme, and appear to be ignoring everything else.
That kind of behaviour is often the precursor to the formation of a bubble, in which objectivity and good sense get thrown out of the window.
Investor sentiment shows itself collectively in the ebb and flow of price action and volumes traded.
It is also reflected in support and resistance levels, trend lines, moving averages and indicators, such as RSI 14.
Why is Investor Sentiment so Important?
Here are several reasons why we should pay attention to investor sentiment and changes in it
It Creates Self-Fulfilling Cycles or Feedback Loops
When investors are optimistic about the future prospects of the market and economy, they tend to buy more equities, driving stock prices higher.
In turn, those higher prices reinforce the positive sentiment, attracting more buyers into the market in a self-perpetuating cycle.
The reverse is also true - excessive pessimism can create greater selling pressure.
In each case, the trend continues until the prevailing sentiment changes.
At which point prices often move dramatically as everyone heads for the exit at once.
Sentiment Determines Risk Appetite
During periods of heightened risk appetite, investors are emboldened and take on more aggressive positions and leverage.
They become comfortable trading in more speculative areas of the market, such as unprofitable/unproven tech stocks, small caps etc, In order to try and outperform.
When sentiment turns, as it inevitably does, that risk appetite dissipates, and money rotates into safer havens.
That is, of course, if it can be extracted from these more speculative areas of the market, where liquidity can quickly evaporate, or become mono-directional overnight.
Sentiment Magnifies Price Trends
Sentiment tends to become ever more bullish during a prolonged uptrend, and overly bearish after a downtrend.
In each case sentiment overshoots the levels, that the fundamentals imply are fair value.
This sort of behaviour can be driven by traits such as anchoring, confirmation, and avaialiability biases.
Anchoring is where we take an incorrect belief, or process, and carry it forward into our future decision making.
Confirmation bias occurs when we shut out any contra opinions, and only listen to ideas and information that match or reinforce our existing views.
Whilst availability bias is the tendency to only rely on information that’s easily, or immediately available to us, rather than looking at, or, seeking out the bigger picture and larger data sets.
Sentiment Regresses to the Mean
Just as stock prices experience mean reversion over longer time horizons, short-term swings between excessive optimism and pessimism often balance out.
Major shifts in sentiment creates opportunities to buy undervalued stocks during periods of bearishness as well as times in which to take profits, during periods of excess bullishness.
Investor Sentiment tends to settle in the middle ground or revert to the mean if you prefer, after period of excess, in either direction.
At which point the process starts all over again, as investors and traders, build their bullish and bearish cases for the markets.
How to Track Sentiment
There are numerous indicators that investors can use to gauge prevailing market sentiment.
These include put/call ratios, bull/bear surveys, volatility indices such as the VIX, as well as fund flow data and momentum indicators.
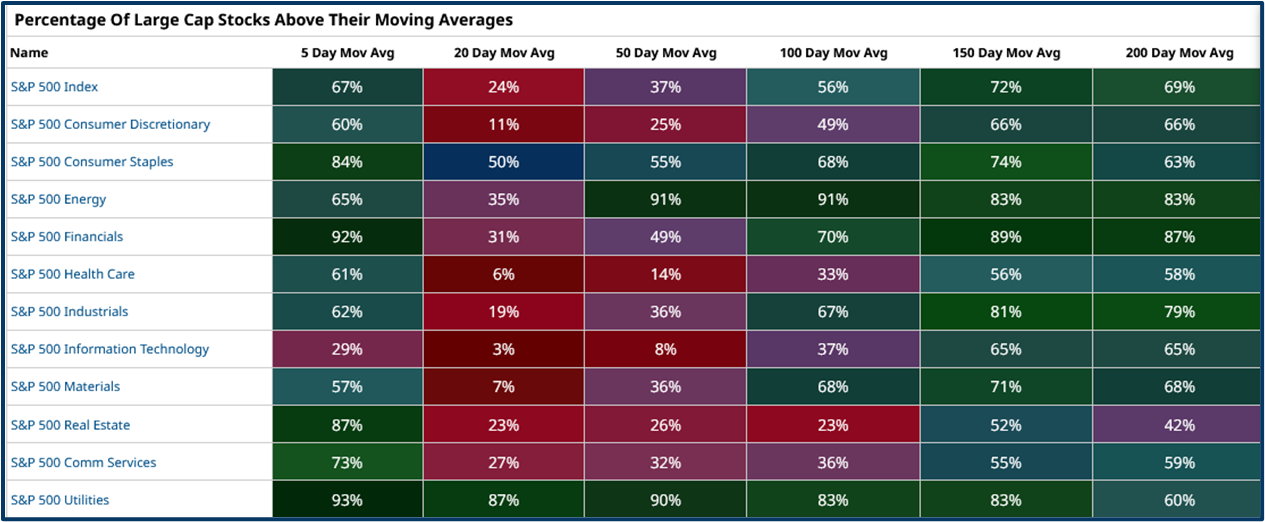
I like to use a mix of indicators but one of my favourites is the MA% indicator (see below), which tracks the percentage of stocks that are trading above key moving averages shown here as a heatmap.
The indicator allows us to judge or gauge sentiment for the index as a whole (in this case the S&P 500) as well as for individual sectors, and groups of sectors. And to make comparisons between one and another.
Source: Barchart.com
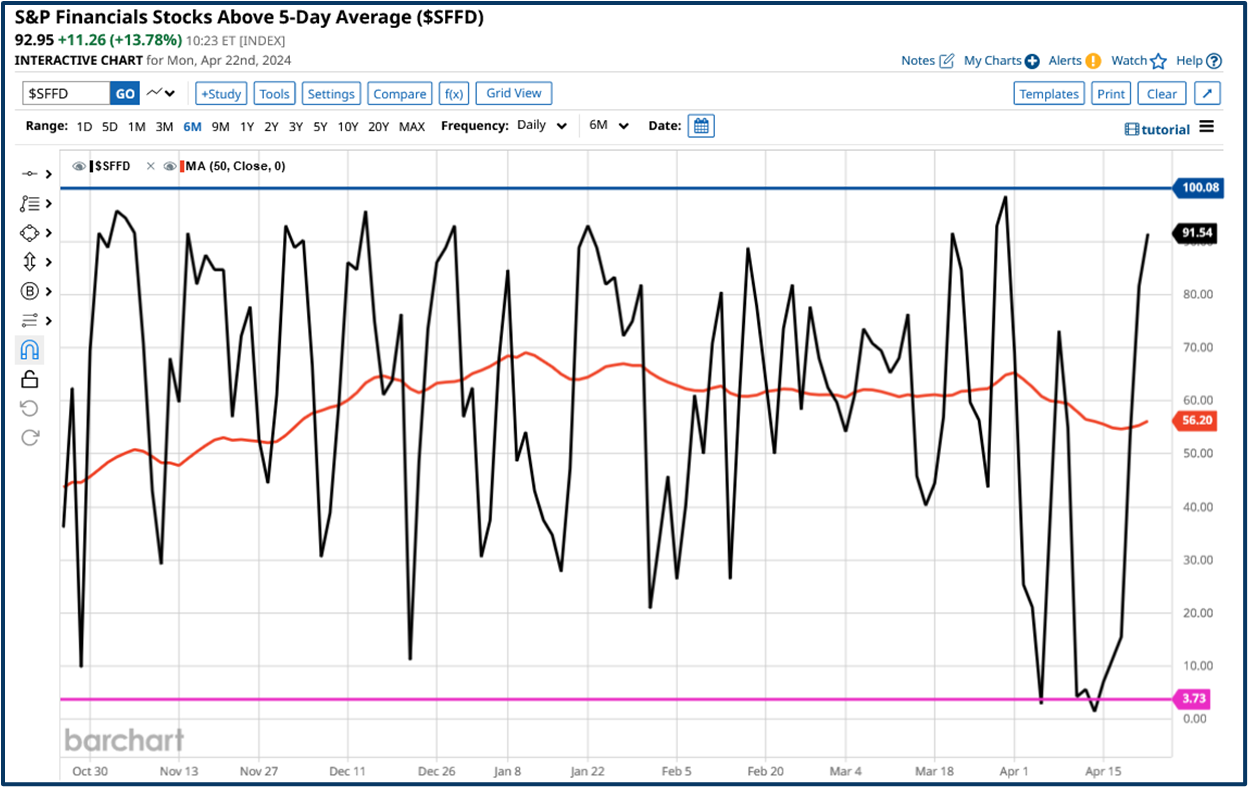
For example, in the chart below we can a see a sharp rebound in the percentage of stocks within the S&P 500 Financials sector, that are trading above their 5 day MA lines.
The rebound in which took us from an oversold level around +3.70%, to an overbought area north of +91.50%.
Source: Barchart.com
My take is, that the higher the number, and the faster the rate of climb in the MA %, then the more bullish sentiment is, and vice versa.
However we need to view these moves in the context of other MA percentages, for both the sector and the wider market.
For example, only 31.0% of the S&P 500 Financial stocks are above their 20 D MA%, and only 24.0% of all stocks, within the S&P 500, were trading above that line, at the time of writing.
Paying attention to sentiment can be very useful when it comes to trading, and trying to time entries into, and exits from the markets, and as such it can be a very powerful decision support tool for traders.
The information provided does not constitute investment research. The material has not been prepared in accordance with the legal requirements designed to promote the independence of investment research and as such is to be considered to be a marketing communication.
All information has been prepared by ActivTrades (“AT”). The information does not contain a record of AT’s prices, or an offer of or solicitation for a transaction in any financial instrument. No representation or warranty is given as to the accuracy or completeness of this information.
Any material provided does not have regard to the specific investment objective and financial situation of any person who may receive it. Past performance is not a reliable indicator of future performance. AT provides an execution-only service. Consequently, any person acting on the information provided does so at their own risk.